USA Population Density Map
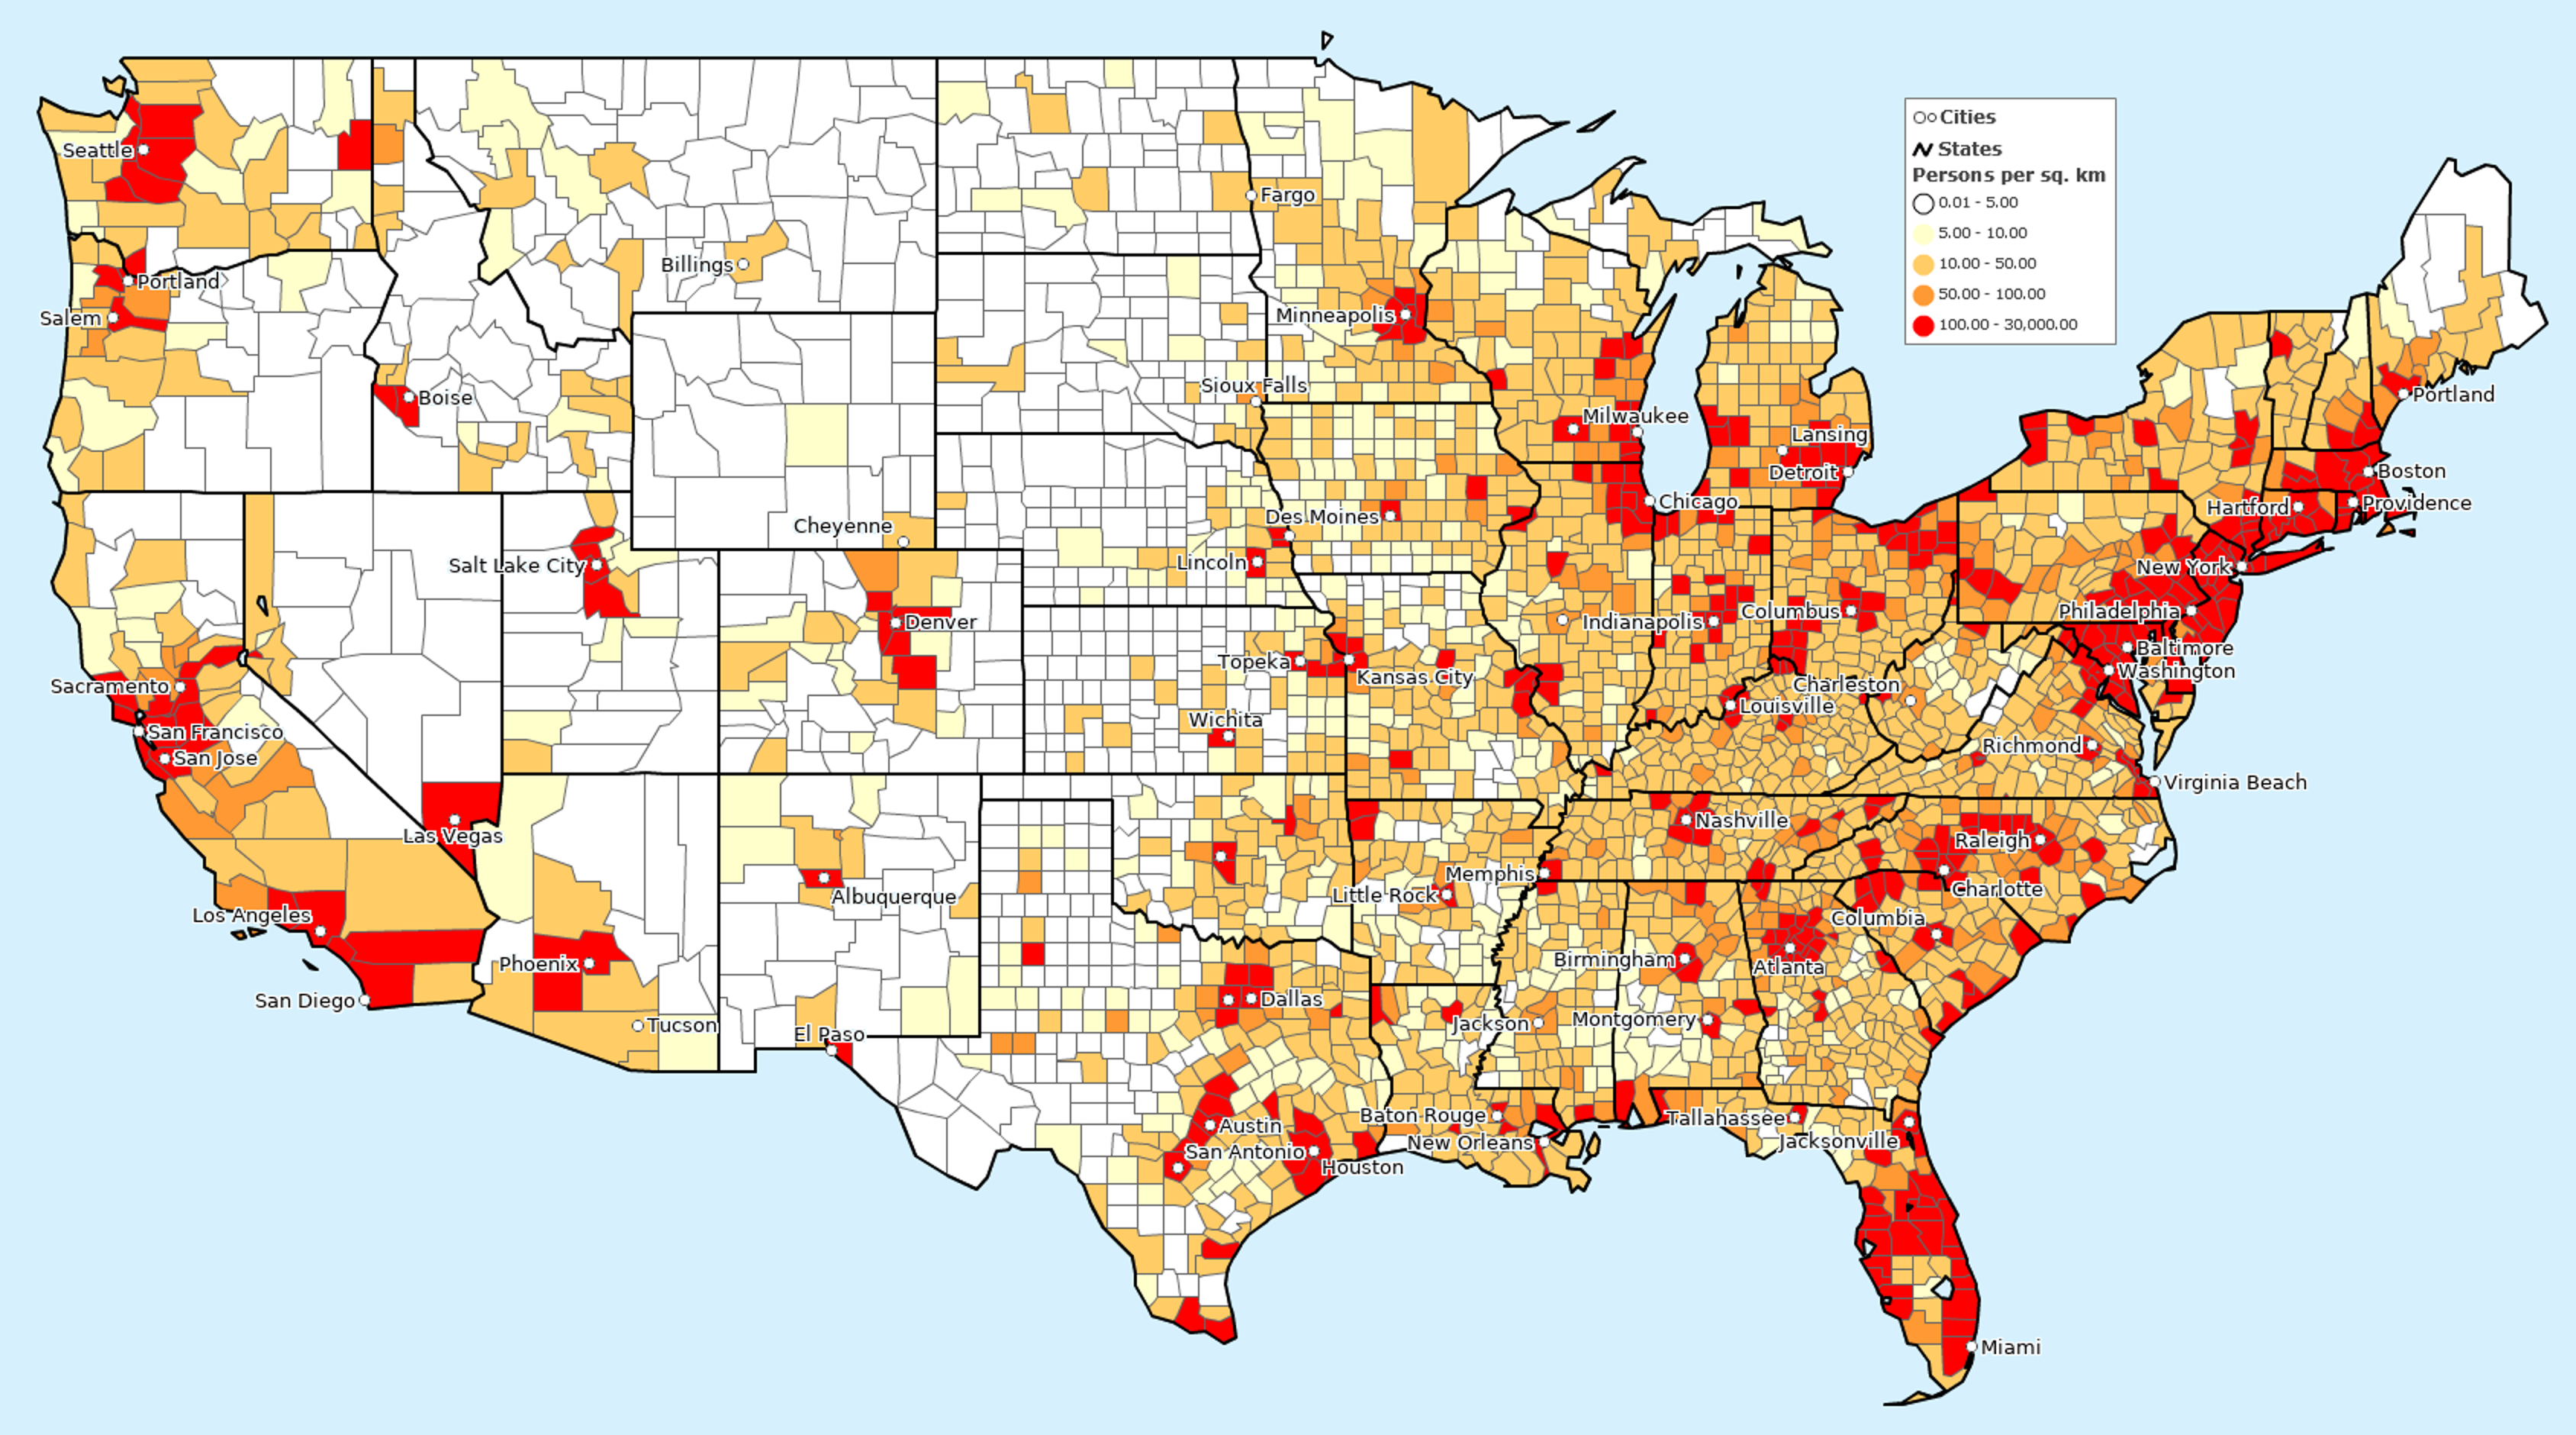
This map shows population density across the United States. Darker areas represent more people per square mile, while lighter areas show rural, less populated regions. From the dense Northeast corridor to the California coast and major metros like Dallas and Chicago, these patterns reveal where Americans live and work.
Open the map in the interactive Viewer app (quick free install required the first time) — explore county-level density across the United States. Pan, zoom, and search places for more detail.
Download high-resolution USA Population Density Map — save a detailed static image for presentations, reports, or planning.
How Businesses Use This Map
-
Site Selection: Compare trade areas by population density to choose the best location.
-
Territory Planning: Balance sales or service territories using population as a key variable.
-
Service Coverage: Align staff, fleets, or outreach campaigns with dense population clusters.
-
Market Analysis: Understand customer potential and competitive landscape by population concentration.
Build Your Own Population Density Map
With MapBusinessOnline you can go beyond a static map image:
-
Build a custom population density map focused on your state, county, or ZIP Codes.
-
Overlay your customer or facility locations to see how they align with population clusters.
-
Export professional-quality maps for presentations and planning documents.
-
Share interactive maps securely with colleagues or stakeholders.
About Population Data
The population density information shown here comes from the American Community Survey (ACS), 2023 survey, released by the US Census Bureau in 2024. The ACS is the most widely used source for up-to-date demographic data in the United States. It provides detailed information about people and households down to small geographies, updated annually.
Population density is calculated as population divided by land area. The map shades each county by this value, making it easy to see where people live most densely. Within MapBusinessOnline, users can explore density by additional geographies such as ZIP Codes or states and combine this data with their own business information.
Frequently Asked Questions
Why show density instead of raw population?
Raw population counts mask spatial distribution. Two regions might have the same total population but vastly different density depending on area size. Density gives insight into where people are concentrated — which is much more relevant for site planning, service coverage, and resource allocation.
Why use ACS data for population density?
ACS is currently the most consistent, frequently updated survey available for U.S. demographics. It allows annual updates and micro-level granularity. While it is an estimate and subject to sampling error, it’s widely trusted by governments, planners, and businesses.
How often is the population density data updated?
Density figures here are based on ACS 2023 data (released by Census in 2024). When the next ACS release becomes available, MapBusinessOnline updates accordingly to reflect new estimates.
Can I combine density data with my own locations or assets?
Yes, within MapBusinessOnline you can overlay your data (customers, assets, etc.) to see how your coverage matches population clusters.


