
All Map Business Online subscriptions include access to demographic data. Paid subscriptions allow exports of that data. Map Business Online versions in the UK and Canada have fewer demographic category option due to the nature of data availability in those nations. Here in the U.S.A., the Census Bureau is quite generous with their data.
Every ten years the U.S. Census Bureau conducts a survey of all American citizens. The Bureau sends out thousands of interviewers, mails millions of surveys, and conducts untold numbers of telephone conversations to count people. All this to get a sense of where every citizen lives and learn critical things about their lives that could impact how the country fairs moving forward. The results are compiled and released as a Census survey.
The last full decennial Census survey was conducted in 2010. The next one is scheduled for 2020. During those in-between years, the Census Bureau issues updates to the most recent full survey via the American Community Survey system. These updates accommodate changes, errors in Census reporting, and “provide more detailed socioeconomic information about the population” on a semi-annual release basis.
Map Business Online subscribes to the Census Bureau’s American Community Survey (ACS) for the USA demographic data included in our business mapping applications. The ACS relies on statistical sampling techniques to estimate demographic totals by category for these mid-decade updates.
A Word About Accuracy
When using Census demographic data from any source it is important to remember that all the published demographic data is an estimate. With many demographic sources available, if you are looking for consistency in data reporting, it is important to research the various Census data programs used as a source. For instance, Map Business Online uses the ACS as our USA data source. Other businesses may access demographic data from other sources.
When comparing demographic data output based on geographic entities such as ZIP codes things can get even more complicated. ZIP codes are not as geographically consistent, across all applications and mapping programs, as one would hope. The Census Bureau publishes ZCTA ZIP codes which do not always match the U.S. Post Office ZIP code areas. Third party publishers of ZIP codes also may vary in boundary definitions; they are usually close but not necessarily equal. All these variables impact demographic data accuracy to an extent. Be aware of which ZIP code system your map or your data source has applied.
Map Business Online provides a ZIP code schema selection in Map & Data. Click the ZIP Code tab. You can choose between ZTCA and USPS ZIPs. ZIP code filler options are listed here too. Fillers provide territory coverage for public lands, national parks, military areas etc. Read more about fillers.
To understand more about how the Census Bureau’s American Community Survey calculates their results and their collection methods read more here.
Please keep in mind that all demographic totals are estimates. If the data results and changes you’re seeing are within 10% there’s a good chance that’s as accurate a demographic count as you are going to get. If you find huge discrepancies, please report them to us and we’ll do our best to research them. There are often legitimate reasons for apparent discrepancies.
Demographic Data in Map Business Online
You will find Map Business Online demographic data accessible from multiple functions within the business mapping application. Look for demographic data in the following areas:
- Market Analysis – Append demographic data to a map layer or summarize multiple demographic categories by location
- Color Code Map – Color code ZIP codes, Counties States or other districts by demographic data
- Search Data & Draw Tools – Both of these functions are designed to draw objects on the map that encourage queries within (or outside of) the areas drawn. The summary button, a sideways M, will lead the user to the demographic category options list
- The Data Window – Access demographic categories using More Data and through the Filter options. Manage demographic data for Territory Maps in the data window
- Map & Data – Access demographic data options for label formatting, color coding the map layer or territory layers
When you access demographic data in Map Business Online it will always be from a data Drop Down option.
For example. On the master toolbar, choose the Circle Search from the Search data options. That’s just to the right of the White X in Red.
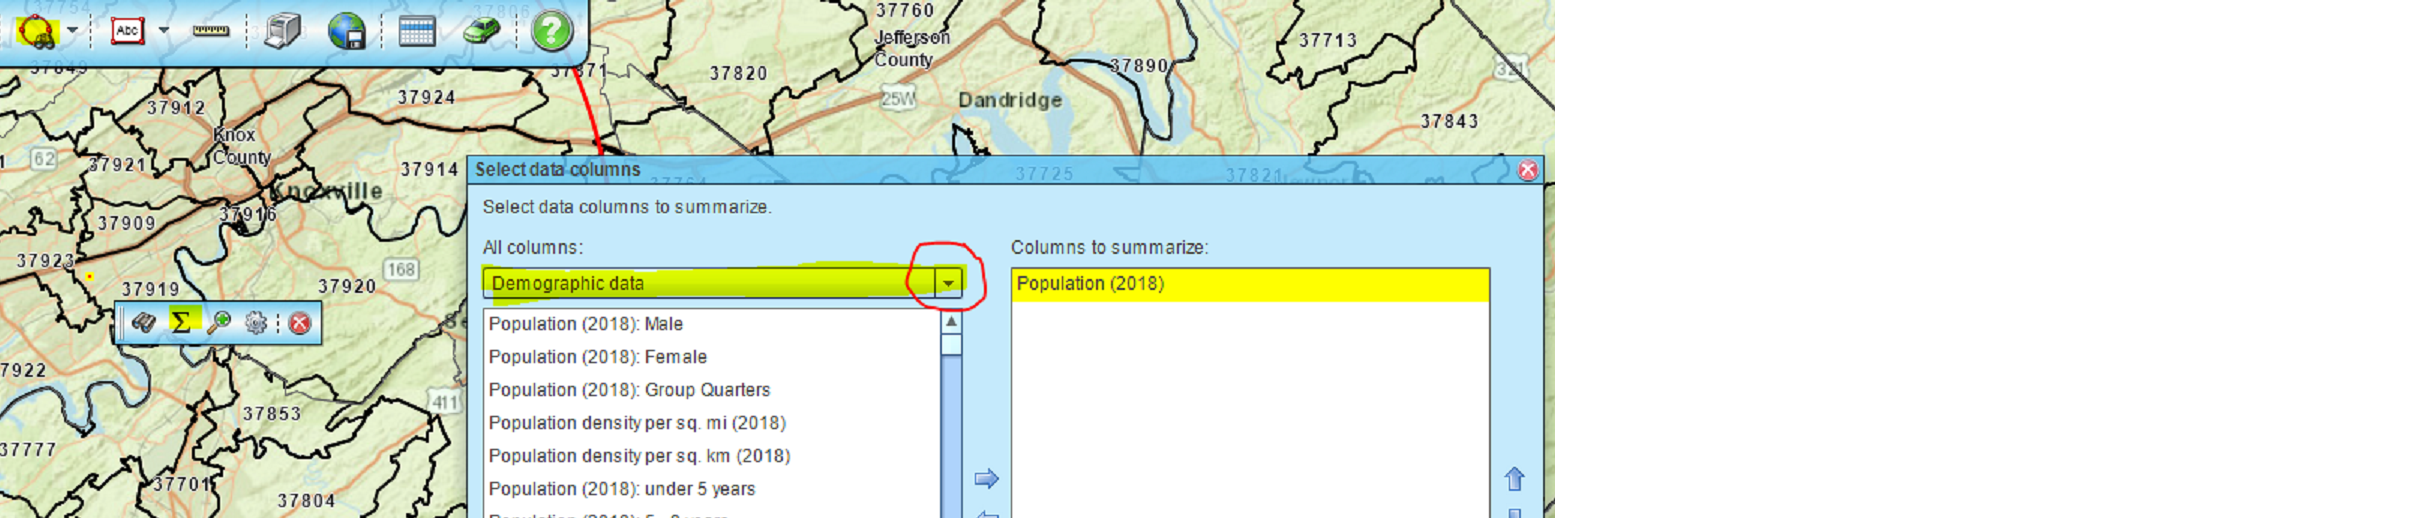
Plot your radius point on the map, then drag or key-in a radius distance measure. Click closed the Search Data dialogue box that pops up. Notice the mini-toolbar associated with your circle. Click the summary button or sideways M.
And there it is, Your Data Drop Down and demographic data at your service. Select up to ten categories for analysis and export.
Looking at all of that demographic data you’ll find eight years of Census releases. The two most recent years are projections that we source through a third-party. The 2016 data is currently the most recent Census ACS release. There are too many categories to name in this blog. Suffice it to say there’s a growing list here that satisfies most demographic data users. Let us know if there are categories missing that we should carry.
Calculating Data
And don’t forget to explore Calculate Data Columns in Map & Data if you want to create sums or ratios of multiple categories. A good example is a summation of all age categories over the age of 65 years.
- Go to Map & Data
- Choose which Map Layer you want to apply the data to and click that layer’s Edit Properties Gear
- Click Calculated Data Columns
- Move your selection demographic data (Age layers) into the Sum box with the move arrows
- Adjust numbering settings
- Save
Now the calculated data option will be listed along with your demographic data in the data drop down for that specific map layer.
Demographic data is used by Map Business Online customer for a variety of analysis and planning operations including business analysis, market exploration, franchise assessments, and retail expansion planning. This is a wealth of information designed and secured for your business benefit. Use it!
Win a $20 Gift Card! Refer a business associate to Map Business Online in exchange for a $20 Amazon Gift Card!
Find out why over 25,000 business users log into www.MapBusinessOnline.com for their business mapping software and advanced sales territory mapping solution. The best replacement for Microsoft MapPoint happens to be the most affordable.
Contact: Geoffrey Ives geoffives@spatialteq.com or Jason Henderson jhenderson@spatialteq.com