
Business mapping is, in large part, the geographic arrangement of business data. Business data that is location-based, containing a locating component, is precious because of its geographic visualization potential. Welcome to the magic of business mapping software.
We can assume your business has a list of customers and the amount of money those customers spent on your products over the last year. For example:
| Customer | Sales Dollars 2020 |
| ABC Corporation | $15,678 |
| Vulcan Electric | $24,789 |
| Gates Rubber Co. | $51,475 |
The above spreadsheet is valuable to an extent. But this spreadsheet is not a dataset that can be viewed geographically. A location-based dataset would include locating components:
| Customer | Sales Dollars 2020 | Address | City | State |
| ABC Corporation | $15,678 | 19 Norwood Ave | Rockport | MA |
| Vulcan Electric | $24,789 | 16 Main Street | Beverly | MA |
| Gates Rubber | $51,475 | 20 School Street | Salem | MA |
The second spreadsheet is location-based. The data can be imported into a map and accurately located. Complete addresses, ZIP codes, counties, and latitude/longitude coordinates enable the geolocation of data on a business map.
Complete addresses and latitude/longitude coordinates are more accurate than only ZIP codes or Cities. ZIP codes alone only provide a centroid point – the center of the ZIP code. County geocoding requires a State for placement on the map.
Imported location datasets can include other numeric data columns. Once the data is in a business map, jurisdiction columns such as ZIP code, City, State, County, or Territory, can be analyzed. Location data can also be analyzed by drawn map objects like circles, polygons, or even rhombuses.
Visualizing Your Business Data
In MapBusinessOnline, data can be aggregated or summed by jurisdiction by appending data in labels or adding data to the Data Window view associated with a map object. Label data aggregations communicate totals by area to the map viewer. Jurisdiction label summations are helpful for sales reporting, count tracking per area, percent calculations, and reporting demographic trends. Read more about appending data to the five flexible label fields in MapBusinessOnline.
Label aggregation of COVID-19 vaccination efforts quickly communicates virus mitigation progress for almost anyone’s area of interest. Labels by area are a fast way to get a numeric point across.
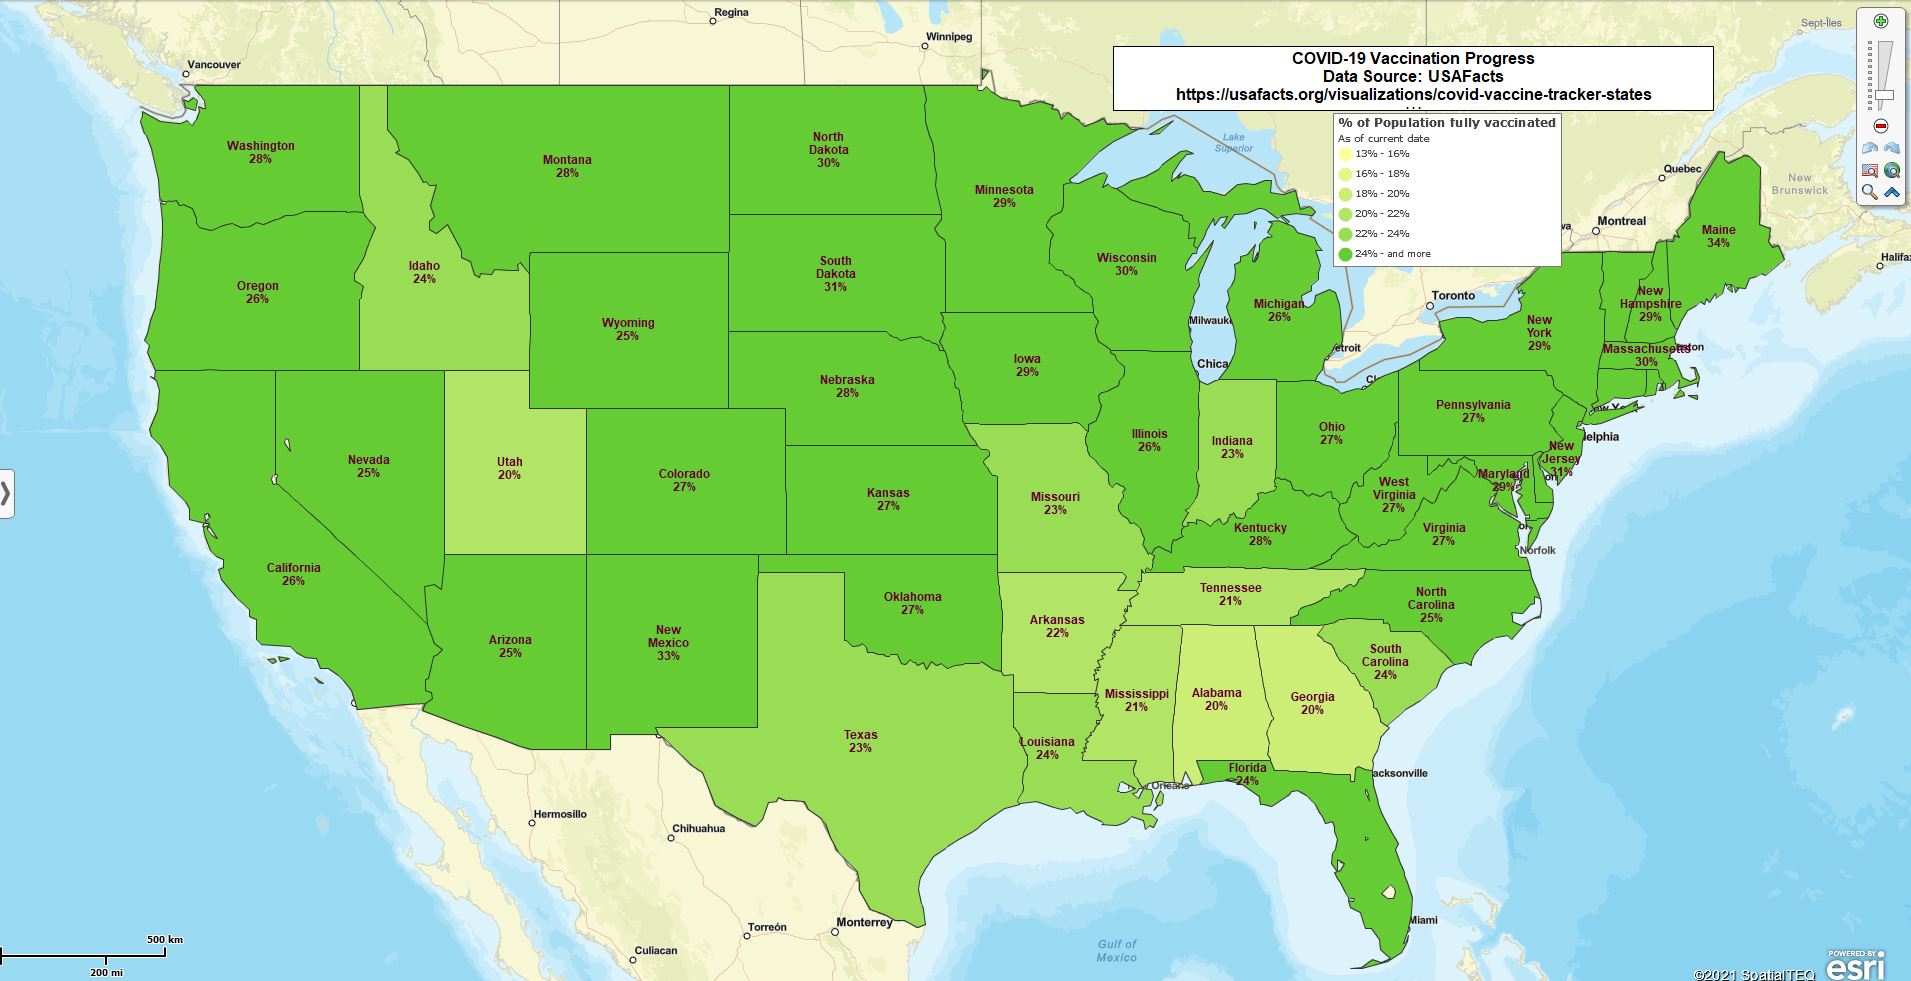
USA Full Vaccination Status as of 4/20/2021
Figure 1: Visual confirmation of COVID-19 vaccination progress by % of the total population, using MapBusinessOnline
Generating Location-based Reports
Overlaying location-based datasets on top of business maps is also a mechanism for analysis and reporting. With a business’s location data imported onto a business map, tabular analysis views are suddenly possible. The data can be arranged in the business map analysis view and exported for use outside the application.
The natural beauty of a business map‘s tabular data view is the many potential data overlays possible. These views support nearly all business and organization types:
- Manufacturing Sales Organizations – Any large or small sales organization will have access to location-based data. CRM systems, ERP systems, Accounts payable records, product sales by region all can be location-based. Find location data and import it into a business map for views and analysis. Popular applications of business map analysis are sales planning, tracking sales results, and expansion planning
- Franchise Organizations – Franchises areas must be sold. Franchise businesses are usually associated with specific areas of interest or territories. Business maps and accompanying analysis present critical demographic and business elements in support of franchise sales
- Marketing Organizations – Identifying market segments based on geographic placement or demographic characteristics is essential for marketing planners. Business maps are excellent identifiers of where and why businesses successfully sell into an area. Marketing pros then take that information and triangulate the results across multiple regions to identify new areas where products and services should sell well
- Operations – Field staff organizations use business maps to establish theaters of operation. Operational maps will efficiently communicate where fieldwork needs to take place. Business maps support construction workers, traveling clinicians, field technicians, and delivery fleets with routing tools, map visualizations, and ZIP code or address lookups, enhancing productivity and improving response results
Select & Arrange Your Data
Analysis views in MapBusinessOnline take place in the Data Window. Map editors can pull various datasets into the analysis view using the Choose Columns button in the lower right corner of any Data Window view.
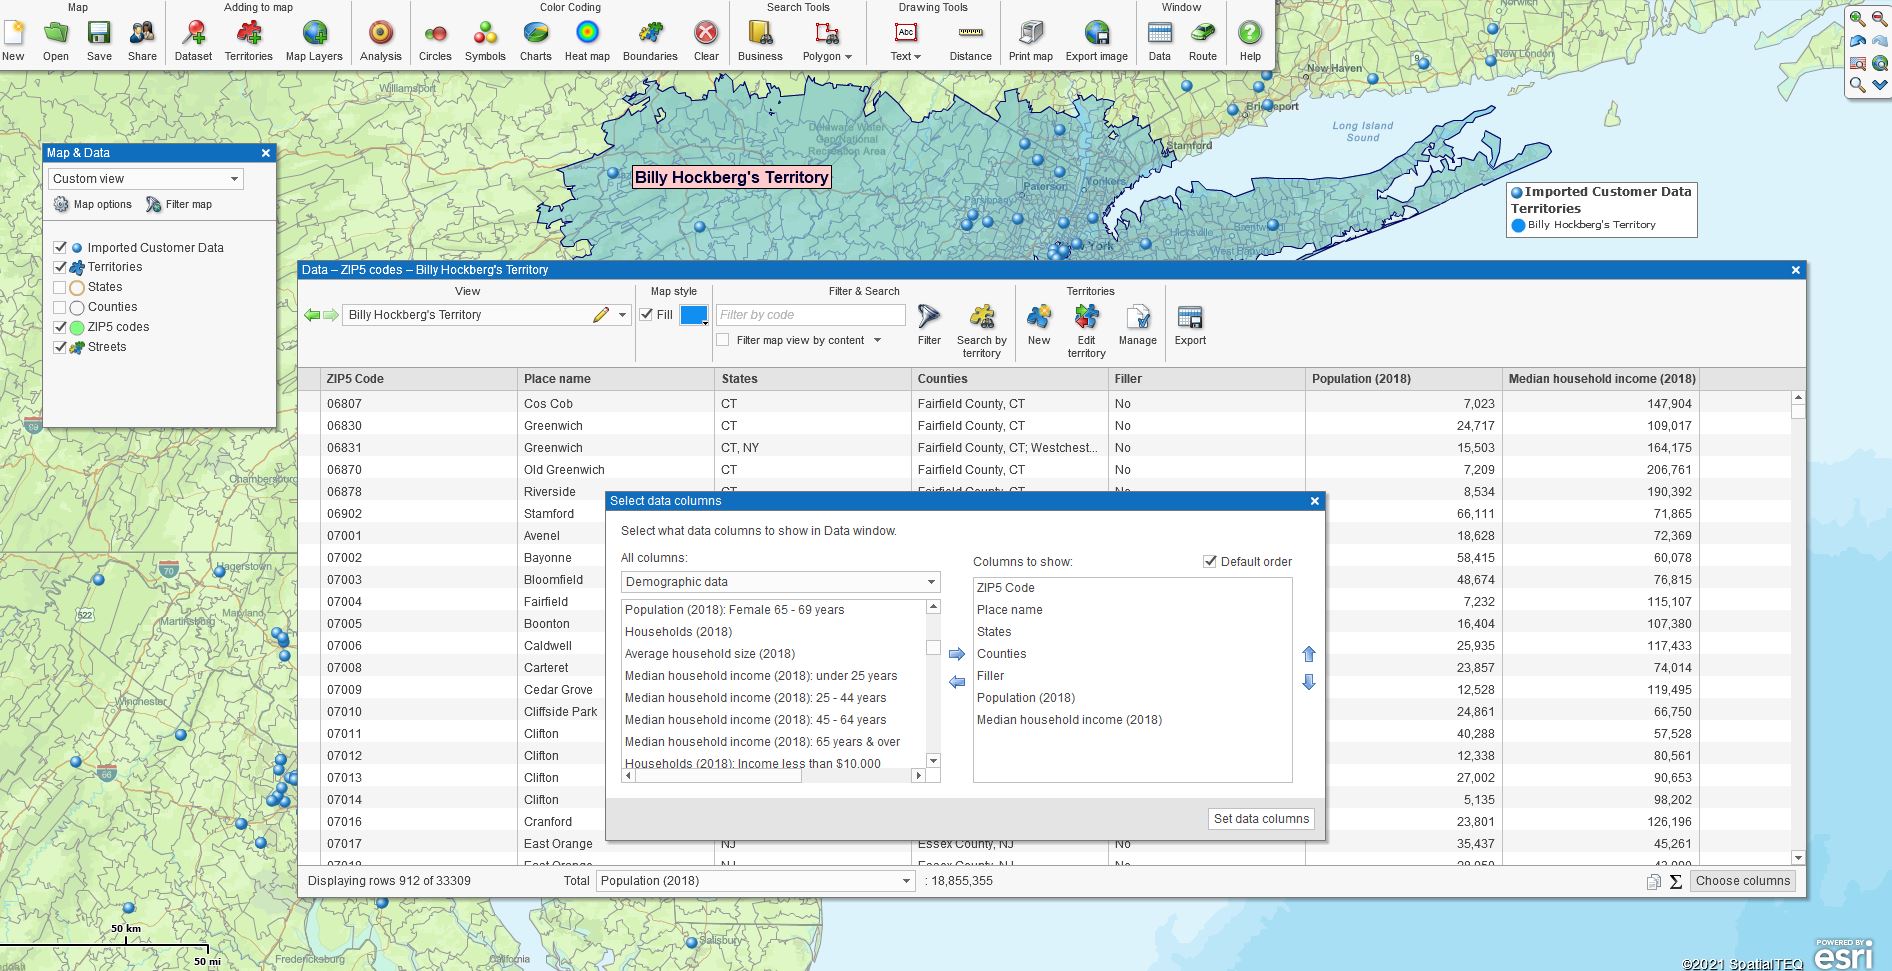
The Choose Columns dialog in the MapBusinessOnline Data Window
Figure 2: Choose Columns dialogue used to create map analysis views in MapBusinessOnline
Read more about the powerful Choose Columns button here.
Chose Columns enable the ability to import and arrange the data presented in the Data Window view. A map creator can remove the default MapBusinessOnline columns and replace them with more relevant data. Further, both map creators and map viewers can filter the data through spatial queries and data filters to generate relevant analysis results for export as reports.
Choose Columns lets the map creator pick one or more columns of imported business data. Often this is the sales data referred to above, but it could be any location-based data relevant to your map analysis. You decide which data is pertinent to your business.
Select columns from the left side of the dialogue and move them to the right using the Arrows in the middle. Move data columns from the right to the left to remove columns from the analysis. Adjust data layers up and down to place columns exactly where you want them in your output.
Choose Columns also provides access to valuable MapBusinessOnline datasets for analysis:
- Demographic data – For USA jurisdictions, you’ll have access to the Census Bureau’s American Community Survey (ACS) data. There are a lot of demographic data across multiple years. Canada jurisdictions provide access to Canadian demographic data
- Geographic data – Work with city, county, state, and ZIP code map layers. MapBusinessOnline Pro lets users add geographic elements to imported data
- Business Listings – A paid service; see credits included with each subscription. Search MapBusinessOnline business listings by polygon, circle, ZIP code, City, or State. Lookup business listings by Industry type (NAICS & SIC codes). Access contacts and phone numbers by business
- Calculated Data Columns – Summed and calculated formulas generated from demographic and imported datasets. Display summations, percentage calculations, ratios. Get creative
Export Your Report
Once the territory columns have been optimized, the entire data view can be exported as a CSV file. MapBusinessOnline’s Data Window has a toolbar along the top. The Export button is the far-right button on the toolbar. Click the button, save the file. Users can open the CSV file from within Microsoft Excel.
Supplement your exported report with exported map images in Jpeg or PNG format. The combined map image and location data report provide documentation for business transactions and market analysis records.
And what sales and marketing pro would not be impressed with a rhombus map object?
_______________________________________________
Find out why over 25,000 business users log into www.MapBusinessOnline.com for their business mapping software and advanced sales territory mapping solution. The best replacement for Microsoft MapPoint happens to be the most affordable.
To access MapBusinessOnline, please register and then download the Map App from the website – https://www.mapbusinessonline.com/App-Download.aspx.
After installing the Map App, the MapBusinessOnline launch button will be in the Windows’ Start Menu or Mac Application folder. Find the MapBusinessOnline folder in the Start Menu scrollbar. Click the folder’s dropdown arrow and choose the MapBusinessOnline option.
The Map App includes the Map Viewer app for free non-subscriber map sharing.
Please read customer reviews or review us at Capterra, or g2crowd
Contact: Geoffrey Ives geoffives@spatialteq.com or Jason Henderson jhenderson@spatialteq.com