
An exciting application for MapBusinessOnline Pro came up this week. The customer was unwilling to share their name as a case study. Consequently, I will describe this business mapping software process generically.
Our client had a significant nationwide list of job sites she wanted to segment by county population totals.
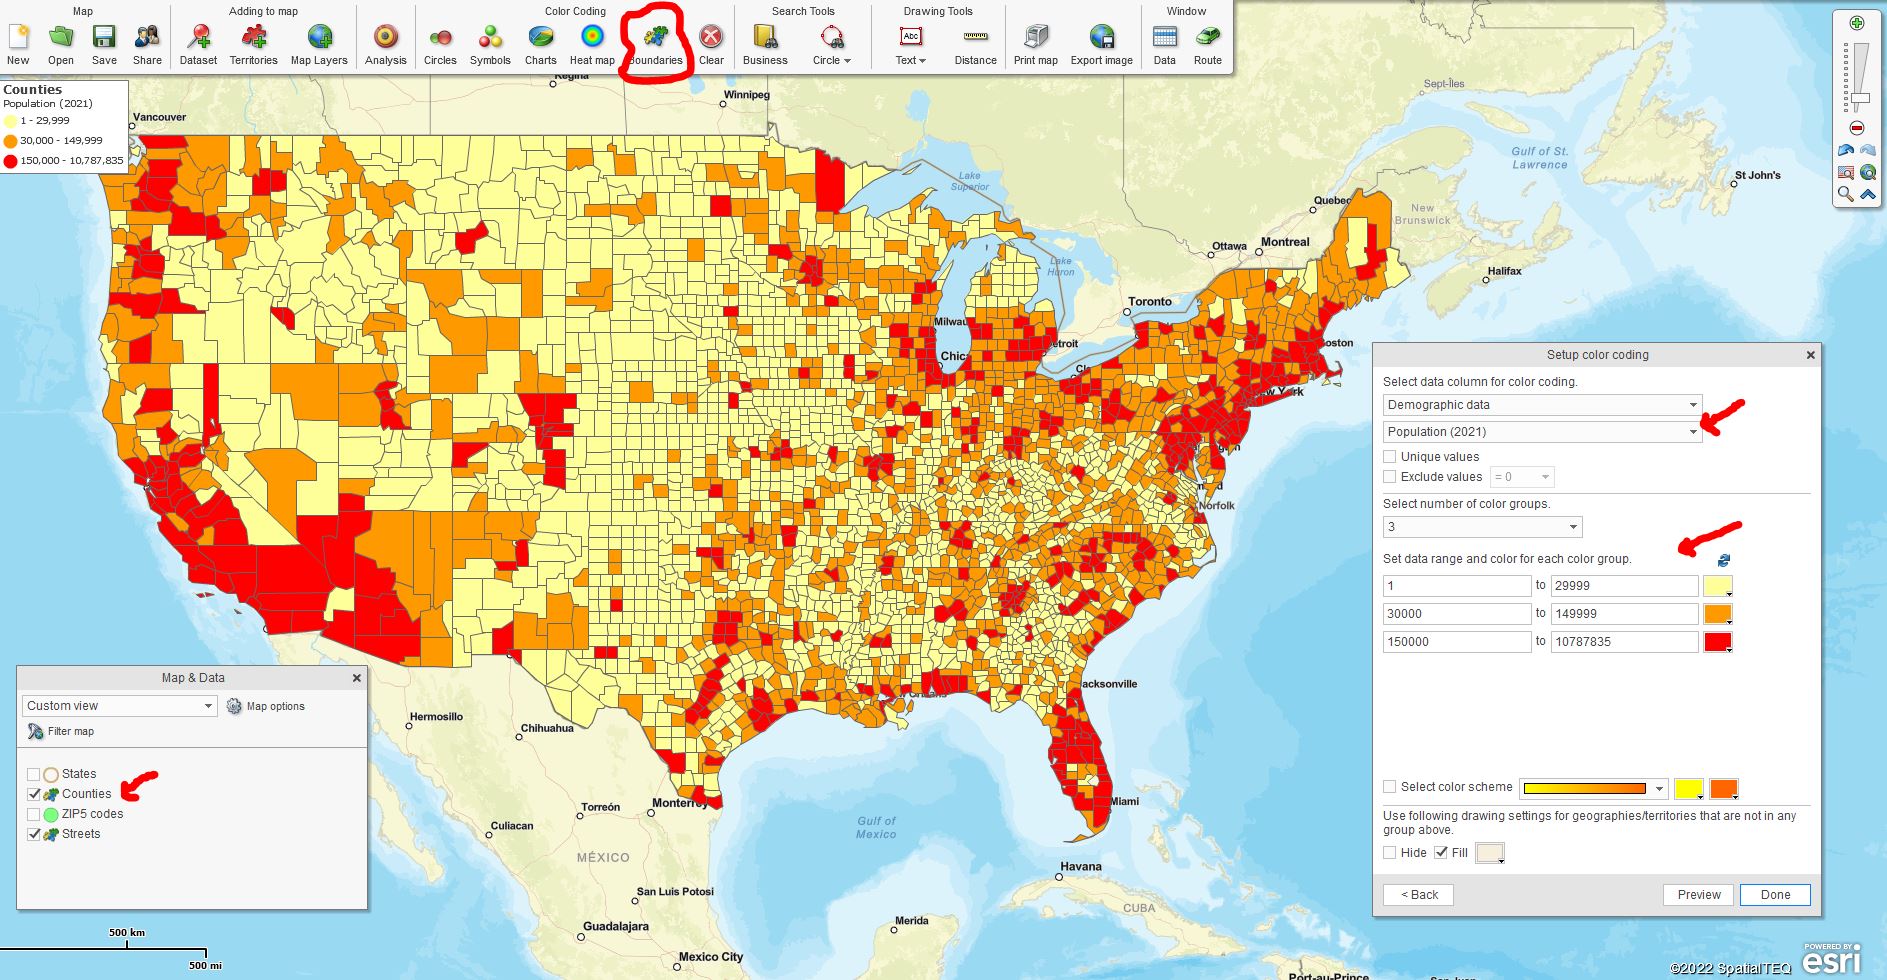
The customer began her business map analysis by creating a color-coded, county-based demographic map of the USA. She divided the counties into three color shades:
- Yellow – for counties with 2021 Populations under 29,999 people.
- Orange – for counties with 2021 Populations from 30,000 to 149,999.
- Red – for counties with 2021 Populations of more than 150,000
The above color-shading is easily achieved in MapBusinessOnline using the Color-Code by Boundaries option on the master toolbar. Read more about color-coding by boundaries here. Demographic mapping is one of the many benefits MapBusinessOnline provides for its loyal subscribers.
The customer used the above map as an informational map view of the USA Population by County. She can share the FREE map interactively through Public map sharing, requiring the map viewer to register and download the Map App. But there is no charge for the map sharing service.
Color-code Counties by Population Using MapBusinessOnline
The customer had also imported a significant location dataset of several thousand nationwide job sites. It was the customer’s goal to be able to export that same list of job sites and segment them by the population scheme we’ve described above. In this way, her goal was to export a dataset of the job sites segmented by population. This requirement was a little trickier than the color-code requirement.
Create Territories by Population
To segment imported location data points based on population, we first needed to create three territories based on population. Sales territory mapping is another popular solution available through MapBusinessOnline. We accomplished this in the Data Window view. The instructions are as follows:
- With the Data Window up, select the County layer.
- Select the Choose Columns button in the lower left.
- In the dropdown on the left side, select Demographic Data and then Pop 2021. Use the Right Blue Arrow to move the Pop 21 into the analysis.
- Click the Choose Columns button closed.
- Next – Choose the Filter button on the Data Window toolbar. We are going to create territories by population. You should, at this point, clear the previously arranged Color Coding (Clear White X button on the Master Toolbar) from the County layer to enable territories by the county to display. To set up the first territory, in the dropdown, select Demographic Data and then Population 2021.
- In the Modifier section on the right, choose <= (greater than and equal to) and input 29,999. Click Filter. This action has filtered the counties to show only counties with 30,000 people or less.
- Click the New Territory button on the Data Window toolbar.
- Name the Territory and Save it. I would name it descriptively – ‘Counties w/Pop up to 29,999.’
- Repeat the filtering process. Return to the filter button view.
- On the existing filter, change the modifier to be > 30,001.
- Click the Add filter button, and again select the Demographic Population 2021.
- This time in the modifier, select <= (less than or equal to) and input 149,999.
- Run the filter.
- Create the new territory and name it.
- Finally, repeat the filtering process.
- Remove the second filter.
- In the remaining filter, change the modifier to > and input 150,000.
- Run the filter, save, and name the third territory.
- With Territories created, we can now export our data and segment by territory.
- In the Data Window view, select the data layer to be exported – Job Sites in this case – and click the Export button on the far right of the Data Window toolbar.
- Select Segment Data Records by Territory.
- Click Next.
The exported report (CSV File) will list all construction site locations segmented by territory. The territories, in this case, represent demographic segments. Be sure the territory names reflect the demographic population segment as filtered.
For some reason, this construction company required a list of job sites arranged by population. Your business might require segmentation by some other demographic category or location dataset. You will note the attached video is based on age ranges. The above-noted approach could be valuable in such cases.
_______________________________________________
Discover why over 25,000 business users log into www.MapBusinessOnline.com for their business mapping software and advanced sales territory mapping solution. The best replacement for Microsoft MapPoint happens to be the most affordable.
To access MapBusinessOnline, please register and download the Map App from the website – https://www.mapbusinessonline.com/App-Download.aspx.
After installing the Map App, the MapBusinessOnline launch button will be in the Windows Start Menu or Mac Application folder. Find the MapBusinessOnline folder in the Start Menu scrollbar. Click the folder’s dropdown arrow and choose the MapBusinessOnline option.
The Map App includes the Map Viewer app for free non-subscriber map sharing.
Please read customer reviews or review us at Capterra or g2crowd.
Contact: Geoffrey Ives at geoffives@spatialteq.com or Jason Henderson at jhenderson@spatialteq.com