
Any business mapping software worth investing in offers a variety of geographic district layers upon which users can base market analysis, sales territories, or operational planning. The layers usually include county, state and zip code districts as boundaried object on the map tied to a simple database. One of the additional or premium layers we offer in the full-year or team edition subscriptions of Map Business Online is the City Limits layer.
City limits add value to a business mapping analysis for a variety of reasons. Let’s face it, metropolitan areas are often where business occurs. Unless your selling freshly squeezed Llama milk or cut, split and delivered cord wood for heating the cabin, there’s nowhere near the level activity occurring in rural areas.
Llama milk aside, city limits alone provide a USA density view of metro areas. This view can be valuable on a business map. Maybe you’ve imported all of your customer locations on to the map as small blue dots. By including a city limit view, you immediately get a sense of rural vs. urban customers. That’s just a basic visualization but it gives the map viewer a quick idea of product, profit, margin, or donor viability based on living in, near or away from a city. Zoom into the map to learn more.
The Map Business Online base map provides building footprint detail in many major cities. This detailed or zoomed in perspective adds another aspect of reality to your business map. You could even change the base-map to an aerial image background or if your feeling frisky, something a little more topographic. At any rate, there are options for base maps in Map & Data.
I like the basic map view of the USA background map with city limits turned on, perhaps shaded a cream or light color. It lets the user see the density of urban areas from a high level. Add a transparent state layer for reference. It’s just a click or two of your cursor. Zoom in gradually on the map. You will notice with each zoom level more city areas come into view. Mapping applications automatically filter the data your presented at specific zoom levels to avoid overwhelming the map user with all the details.
In Map Business Online, City limit data means each city is represented by a defined area. These city areas on the map can be color coded to reflect business or demographic realities. Map users can color codes cities based on the amount of sales sold in the area or users can color shade the cities to reflect population. A basic data count by zip code, city or county can be easily applied as an area shading. You could color code city limits by sales dollars, staff counts, alcohol consumed, or even cats per city. Find some data and color code your city.
City limit areas can be used to create sales territories as well. Franchise businesses might find this useful especially in areas where zip codes are too small to fulfill sales quotas. Cities may be a great option for defining regional districts, while zip codes or Census tracts cover territories. Census Tracts can be very helpful in conjunction with City Limits especially in heavily populated cities where zip code territories are just too big. Census Tracts can offer a more granular viewing option.
Cities could also be used independent of county, zip code or state territories, as an additional map layer used to display sales results by metro-region. This is handy for depicting activity by metro-regions without impacting actual territory map representation.
Experiment with the City Limits layers. Turn off the background map and just leave the City Limit layer turned on. Color code by sales for 2015-2016. What does this view tell you?
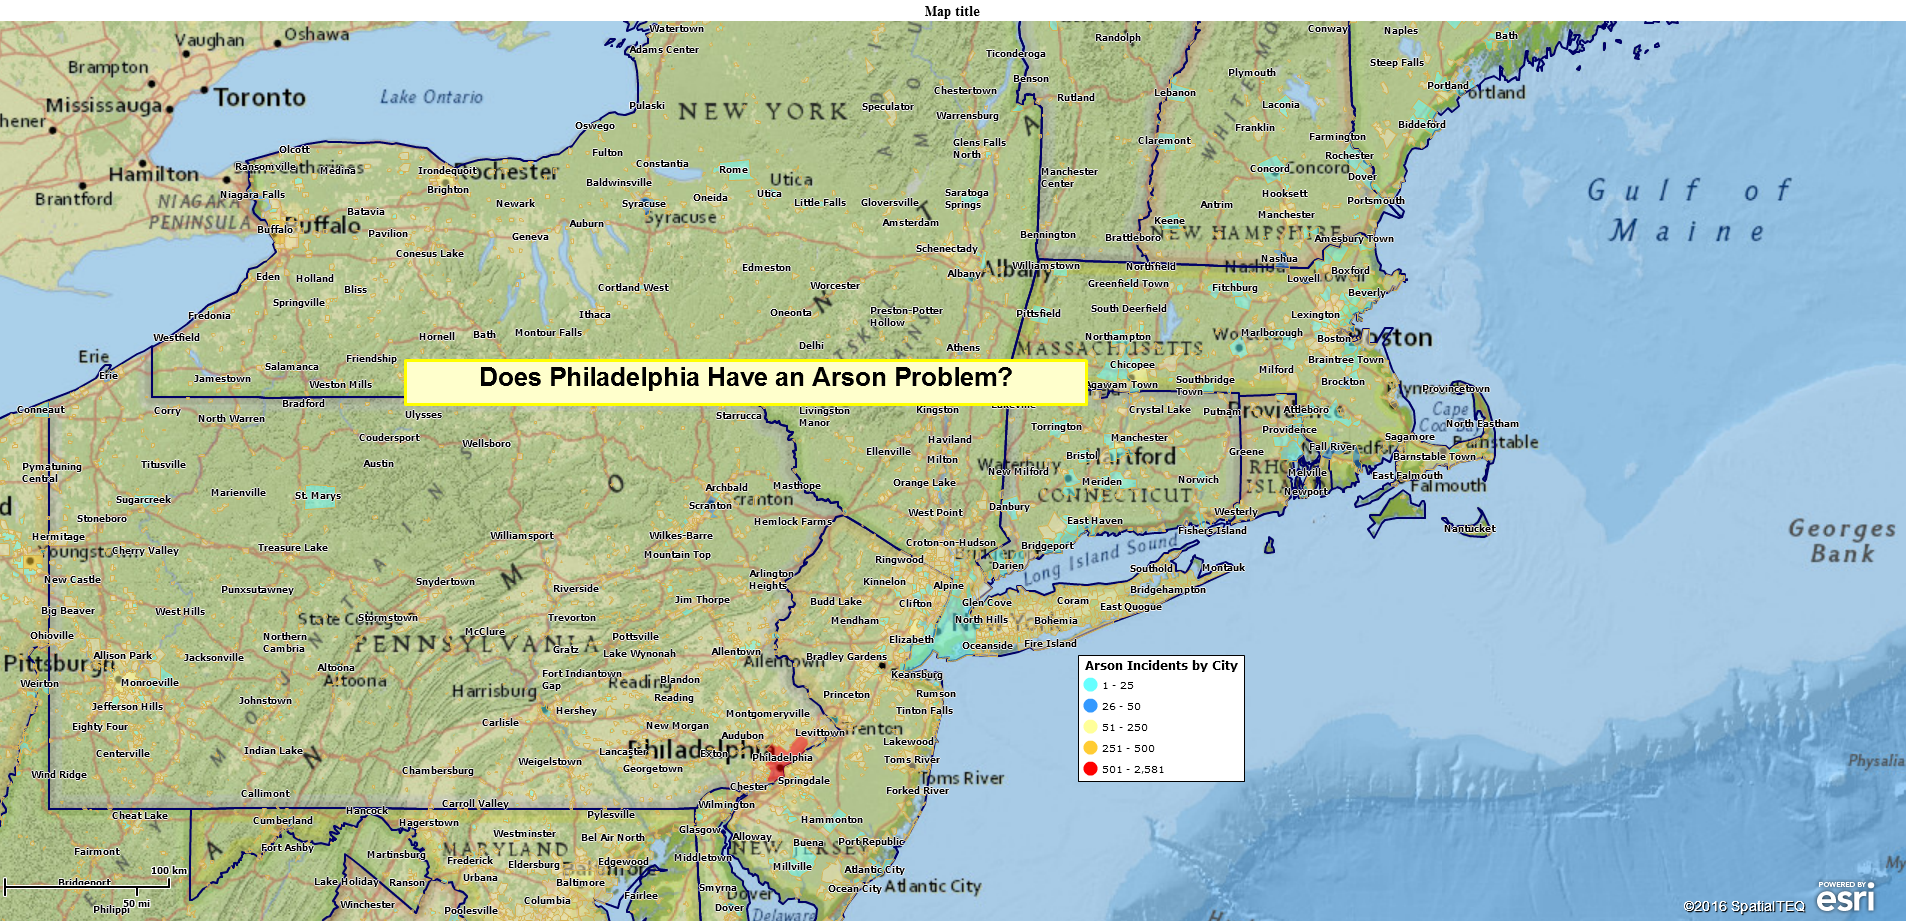
Import crime statistics and color code arson by city limits. What cities have the biggest arson problem?
Color code the City Limit layer by household income level or other demographic data options. Use the Data Window filter tool to show only those City Limits where you do business. Save that view. Now filter for where you do not do business. What do those two views tell you?
Map Business Online includes some extra Public Data with the application – crime statistics, school information and all the USPS zip codes as a point dataset. Business managers all have access (free or paid) to a variety of pertinent data sets that can add value to a business map analysis project:
· Customer data – Location points by address or lat/lon, sales or shipments per location
· Industry data – Industry product sales by zip code, industry trends by zip code
· Competitor data – Competitor locations by address, competitor sales numbers
· Google analytics – Sales data by location
Look for data that is meaningful in your business. Don’t forget to explore the City limits data in Map Business Online.
Map Business Online – Easy, affordable, advanced and we’ll help.
Find out why over 25,000 business users log into www.MapBusinessOnline.com
Contact: Geoffrey Ives geoffives@spatialteq.com (800) 425-9035, (207) 939-6866
MapPoint users – please consider www.MapBusinessOnline.com as your MapPoint Replacement.
Please read customer reviews or review us at Capterra, or at the Salesforce.com AppExchange.