
In my experience, when a company officer or high-level manager announces their intention to conduct a SWOT analysis, I know it’s time to polish up my resume. A management team member should also process the Strengths, Weaknesses, Opportunities, and Threats analysis in good times. Unfortunately, businesses tend to remember to test the lifeboats just before the ship sinks.
For the uninitiated, SWOT stands for Strengths, Weaknesses, Opportunities, and Threats. The idea is to identify lists of business realities under these four key areas and develop strategies to move the organization forward in light of the SWOT analysis results.
Business maps are a critical tool to apply to a SWOT analysis. They add a visualization component and the ability to study relevant location-based datasets that may reveal elements about your business never before understood. Think of a SWOT map as the first step to understanding more about your business:
- Why are our profit margins declining?
- Why is this area offering more opportunities than others?
- Why are Internet-based companies replacing local merchants in your industry?
Strengths
Strengths refer to aspects of the business that are going well. These ‘good’ aspects could be a list of products or services that generate income and achieve goals. Strengths could be financial, labor-related, or position in the marketplace.
A business map analysis of strengths might involve identifying areas in the marketplace where sales are at or above goal. Understanding why products or services are selling well in certain areas is an obvious key to expanding that success into new areas.
Middle ages England, for centuries the backwater of civilization, suddenly found itself in an advantageous position as the voyages of discovery determined the world was round and nations started competing for opportunities in the New World. All of a sudden, England had a few strengths. Strengths could also be related to resource and asset placements concerning key markets.
Location-based datasets that indicate strengths might be:
- Company warehouse locations
- Top-25 customer locations
- Top-selling products by location
Traveling employees’ and customers’ driving time and distance realities could be viewed as strengths or weaknesses. See MapBusinessOnline Pro for a select set of driving time analysis tools.
Weaknesses
Many would say weaknesses are the opposite of your strengths. Typically, the ZIP codes where you’re not selling are weak areas for your sales team. Perhaps let business maps guide your decision-makers to a more proactive stance on weaknesses. Create a business map detailing your sales by profit margin, year-over-year. Add in sales personnel locations with estimated daily driving times and overall cost of sales included.
Cost-based data help illuminate where your costs-to-market are eroding profitability. Weaknesses may not resolve by throwing more sales and marketing at the problem. A distribution issue could indicate a change in logistics may be in order.
Weaknesses are exposed through infrastructure mapping. A weakness could be the rising costs of doing business. As companies grow, they reach plateaus in scalability, where investment may be required to achieve the next growth milestone. Look for location data within your business related to shipping and warehouse systems. Consider uploading location data that reflect shipping costs and shipping cost trends across the nation.
Energy costs may be a concern. Comparing all company facilities by location with the top five associated expenses may be helpful. See if there’s an industry standard for some of these expenses. Include an analysis of productivity by employees at each location. Reveal those facilities that are outperforming others and find out why.
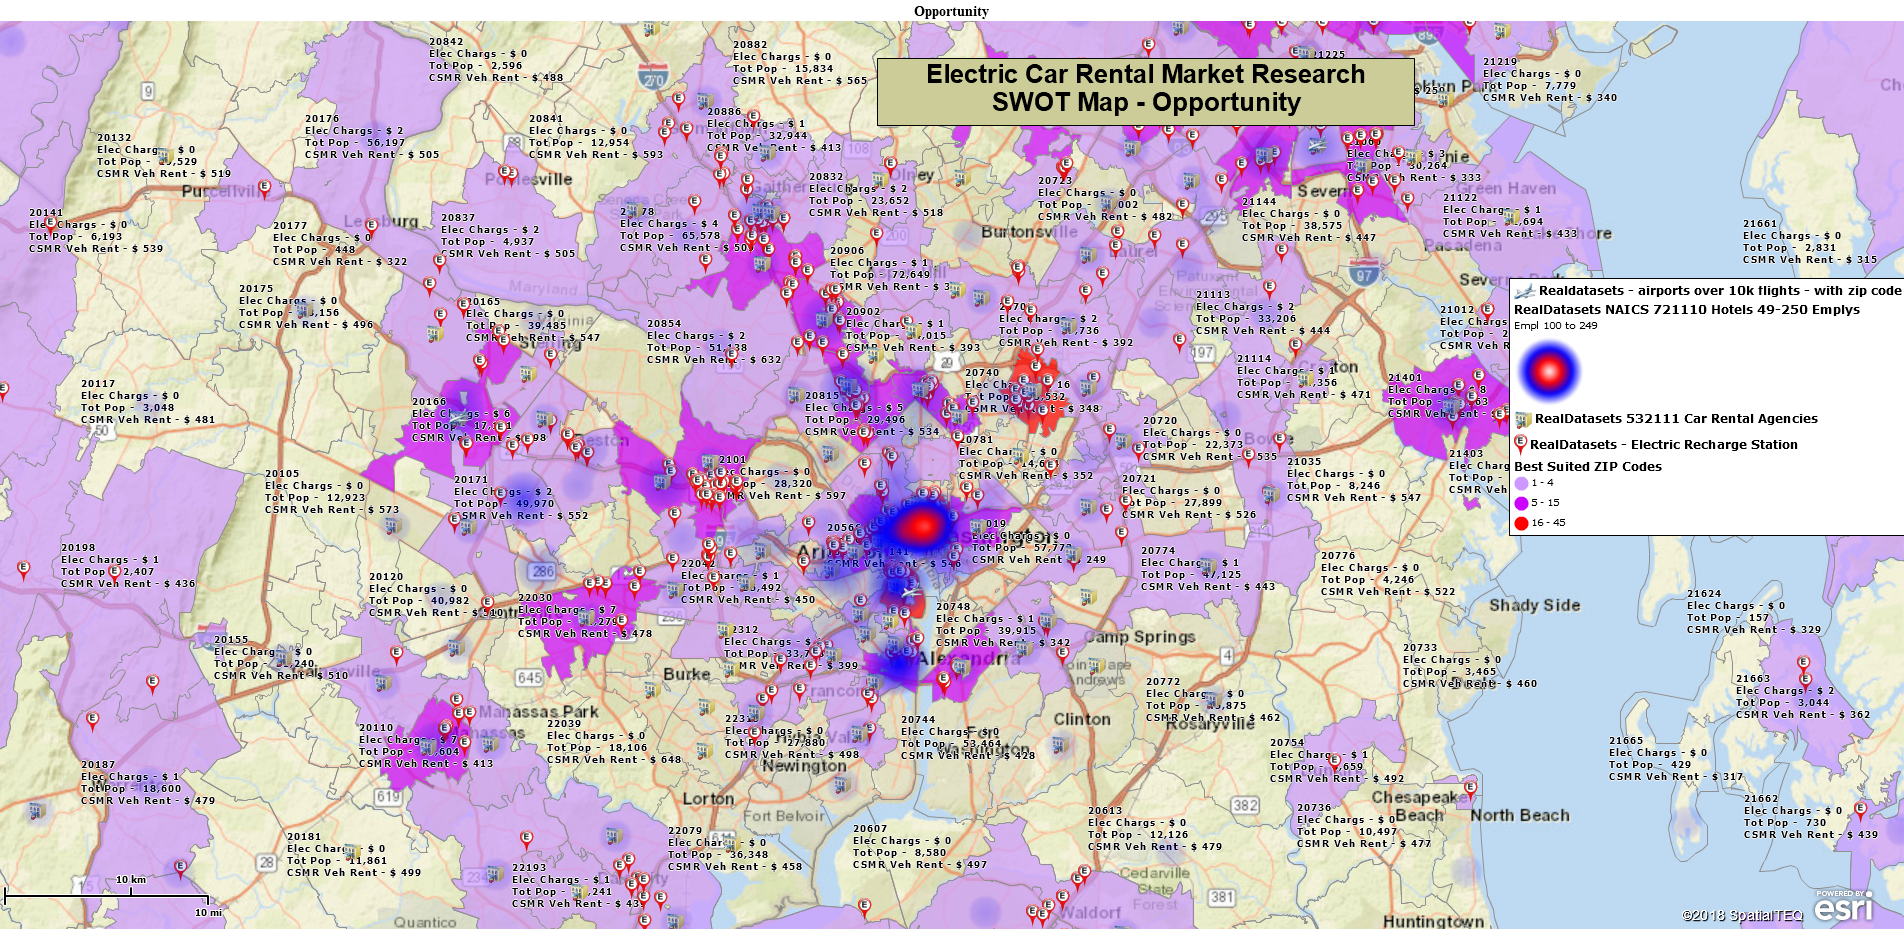
Opportunities
Opportunities are probably more than just new sales prospects. Opportunities come in many shapes and sizes. Opportunities might be hidden in marketplace details:
- Color code jurisdictions (city limits) by tax rates.
- Conduct a labor analysis across all locations and profile other metro areas for alternative labor sources.
- Are there similar businesses for sale in other areas of the country? Maybe you should be an Internet sales organization; selling online can provide a severe tax break.
Be sure to ask critical questions that expose new ways of thinking:
- Who would buy us out if they could?
- Are we better served from more shipping locations or fewer shipping locations?
- What are the five best labor markets for our business across the nation? What do our markets look like surrounding those cities?
- Are there areas in our market coverage with serious overlapping sales support?
Threats
Threats are wicked critical. It seems to me the whole point of a SWOT analysis is coping with threats. A prominent location-based threat layer is competitors. So make sure to import a list of competitor addresses. Perhaps dig a little deeper into competitors for your SWOT analysis. Consider multiple levels of competitor threats:
- List by name the locations of all significant and usual competitors
- Classify competitors by type – online, big-box, local, overseas, direct
- Pull in distributor locations by address – color-coded by competing products offered
Import multiple and relevant location-based datasets to your SWOT map to expose more business patterns. For SWOT maps, and specifically for threat exposure, consider these datasets:
- The location of traveling sales employees.
- Shipping locations for web-based competitors exposing brick & mortar threats.
- Critical supply sources for retailers and manufacturers.
- Electrical utility supply rates by supplier site across the nation.
- Known bottlenecks in the supply chain by location.
SWOT analysis is not a place for rugged individualism; it’s a team sport. Create your SWOT threat map by importing threat layers and viewing them over essential business layers. View them with an associate to get more opinions and ideas about what your map should include.
I wrote a blog titled How to Create a Business Marketing Map some time ago. Many of those same rules apply to SWOT maps, mainly:
- Get clear on your map’s purpose and keep this in mind as you develop and present.
- Do not turn on all layers – be selective.
- Use heat maps to make the most critical point, if possible.
If you have a lot of data, consider four element maps (SWOT) and one highlights map that reviews the critical elements of your SWOT analysis. With SWOT maps I would strongly suggest that you utilize several maps. Perhaps one map for Strengths and Weaknesses and another for Opportunities and Threats.
Remember, you can always build a map template first with most of the layers included. Begin new maps from that map template, saving them in the MapBusinessOnline My Maps folder. The process would be as follows:
- Create a map template in the My Template folder.
- Create a subset My Map folder as Strengths map.
- Do the same for other SWOT categories.
- Have your meeting and adjust maps as necessary.
SWOT analyses are often painful. Bringing map visualizations to the process can speed up the analysis, exposing critical issues sooner rather than later. Bad news sooner beats bad news later every time.
_______________________________________________
Discover why over 25,000 business users log into www.MapBusinessOnline.com for their business mapping software and advanced sales territory mapping solution. The best replacement for Microsoft MapPoint happens to be the most affordable.
To access MapBusinessOnline, please register and download the Map App from the website – https://www.mapbusinessonline.com/App-Download.aspx.
After installing the Map App, the MapBusinessOnline launch button will be in the Windows Start Menu or Mac Application folder. Find the MapBusinessOnline folder in the Start Menu scrollbar. Click the folder’s dropdown arrow and choose the MapBusinessOnline option.
The Map App includes the Map Viewer app for free non-subscriber map sharing.
Please read customer reviews or review us at Capterra or g2crowd.
Contact: Geoffrey Ives at geoffives@spatialteq.com or Jason Henderson at jhenderson@spatialteq.com.