
In addition to business mapping core graphic and data tools, MapBusinessOnline includes a set of supplementary features that add tremendous value to both MapBusinessOnline Standard and Pro versions.
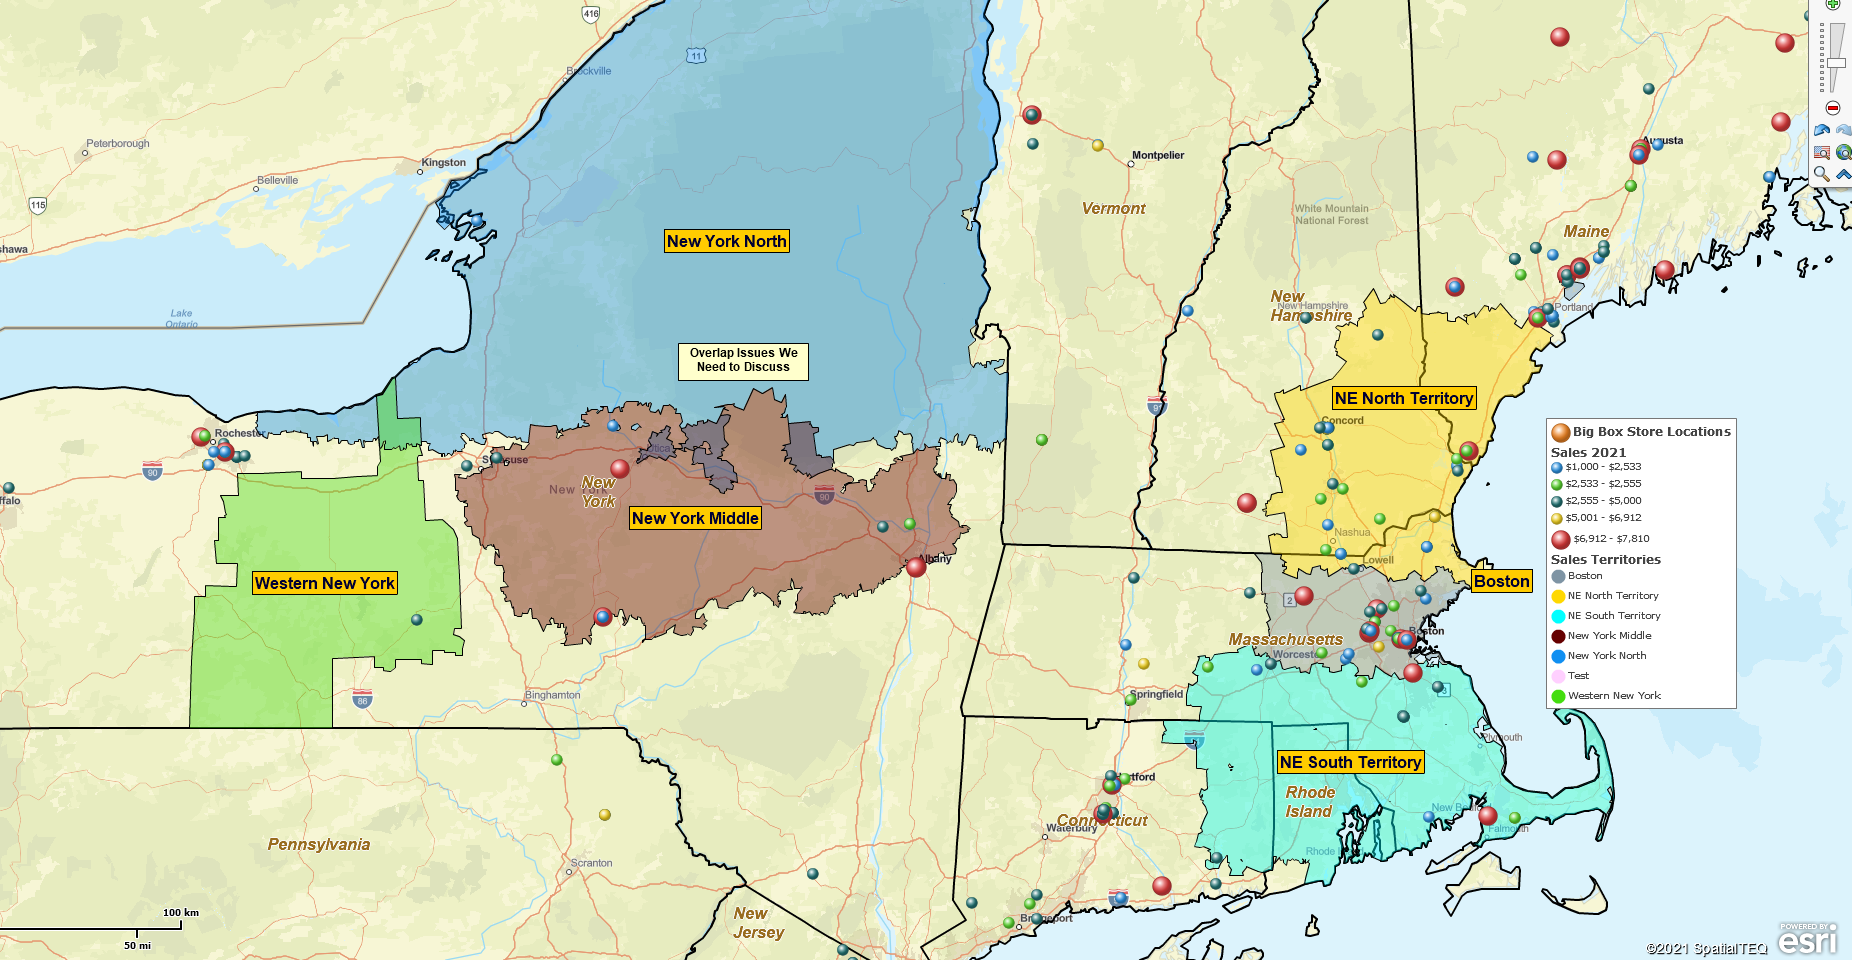
Managing Sales Territories Using MapBusinessOnline
We tend to talk about creating sales territories, color-coding imported customer locations, and finding more hot breweries to visit. (Maine is, after all, arguably the brewery capital of the USA.) Here are some additional MapBusinessOnline features included in our business mapping software that you may not be aware of.
USA School Systems Data – Not for everybody? Sure, but if part of your job is to compile a map of public and private school systems across the USA or a region, we’ve got you covered. Located in the Dataset – > Public Data folder, users can import point layers that describe school names, addresses, number of students and teachers, and basic information about each school.
Create a business map describing school systems. These school point layers are split into four nationwide sections because they are significant. Use the point views to create school district territories by ZIP code. View school district maps as a guide for cannabis retail outlet and grow-facility placements. (Because these new businesses shouldn’t exist next to a school.)

Calculated Data Columns – Calculated Data Columns is accessed by map layer in the Map and Data box. You’ll find this functionality in Map and Data when you click the Edit Map Layer Properties button. Scroll down to see the Calculate Data tool.
A Calculated Data Column is a basic formula. The tool allows map creators to sum or divide data columns with each other. Any Calculated Data result is available for use in Data Window analysis and the color-coding functions of MapBusinessOnline. Examples of how to use this powerful tool include:
- Sum numeric data columns across like demographic data categories – income by age, population by age, or related consumer expenditures.
- Divide demographic categories by entire populations to create ratios and percentages.
- Divide or sum columns from imported business data. Or combine imported data with demographic categories. Get creative.
Create market analysis with demographic rankings. See our customer case study example.
Search & Segment Data Across Multiple Center Points by Radius
The first option under Analysis, Search & Segment lets the business map user collect geographic segments, like ZIP codes, for a defined radius around multiple center points. You can even draw the circles around up to 200 points at one time while generating territories based on City limits, Counties, or ZIP codes.
Use this tool to determine how many records from Dataset B fall within a radius of X miles of Dataset A. Save the results as a subset list in the Data Window. Check the Filter Map View by Content box to show only those records on the map.
Search and Segment Data is powerful functionality. It will give you a taste of the power of MapBusinessOnline Pro, which can add Driving time and Driving distance analysis to the party. Read more about the difference between MapBusinessOnline Standard and Pro.

Search & Segment Multiple Points by Driving Time (Pro feature)
Business Listings
Although this service can cost a little money ($0.15 per business listing), searching and downloading business listings works similarly to importing business address records. The tool is in the middle of the Master Toolbar under Search Tools. It’s the Yellow Pages icon with the binoculars.
Search for listings by NAICS or SIC Industry Code, business name, keywords, or search geographically. Plot business data points on the map and view firmographic data in the Data Window view.
- Create competitor maps that display all your competing stores or offices on the map.
- Find new customers based on industry type.
- Filter and export records for use outside the application.
- Secure contact information by company.
Add a visual point layer of competing companies or key resource locations to business analysis maps. Generate outbound call campaign contact lists by title.
Data Window – Choose Columns and Data Filtering
Not all of us working saps is a database wizard. Excel spreadsheets are as far as we got for many of us, riding the wave of technical advancement sweeping the world since 1980 (when I entered the workplace.)
But database management tools don’t have to be SQL to be effective. MapBusinessOnline includes several light database management tools in the Data Window. Don’t be intimidated.
In the Data Window, click the Choose Column button in the lower right. Use Choose Columns to add demographic data, calculated data columns, and imported business location data to your analysis. Move data in from the left side, and pull data out from the right side.
Now close the Choose Columns function, and return to the Data Window toolbar to explore filtering options.
With imported data or a MapBusinessOnline map layer selected in the Data Window dropdown, the map creator or map viewer can filter that data using the Filter & Search section of the Data Window toolbar.
The ‘Filter by code‘ search box lets the user input a search term to quickly filter the left-most column of data. Search by name, number, or range of numbers.
For example, select the ZIP code layer in the data dropdown. To set a filter range, put in a ZIP code, then a dash, and the end ZIP code number. Wicked easy.
More advanced filtering happens when the user clicks the Funnel icon to the right of the ‘Filter by code’ search box. The funnel opens a full-featured data filter tool:
- Select MapBusinessOnline map data layers, purchased business listings, calculated data results, or imported data for filtering in the Data Window dropdown.
- Apply modifiers such as >, <, =, ‘contains’, ‘one of’, or ‘not one of’. Try it. You’ll see the full list of modifying options enabling a variety of filtering options.
- Export filtered data results for use outside of MapBusinessOnline
- Save the filtered data results as a territory or a marketing list.
A business map users could apply MapBusinessOnline data filtering to:
- Generate subset location-based business intelligence reports.
- Conduct market analysis on city, ZIP code, or county map layers.
- Define ZIP code-based territories by demographic characteristics.
MapBusinessOnline includes various tools and features. Users will discover many direct and supplemental ways to explore geographies and geographic data and solve business problems.
Thank God for business problems. Without them, we’d all be unemployed, stuck at home watching TikTok videos.
_______________________________________________
Find out why over 25,000 business users log into www.MapBusinessOnline.com for their business mapping software and advanced sales territory mapping solution. The best replacement for Microsoft MapPoint happens to be the most affordable.
To access MapBusinessOnline, please register and then download the Map App from the website – https://www.mapbusinessonline.com/App-Download.aspx.
After installing the Map App, the MapBusinessOnline launch button will be in the Windows’ Start Menu or Mac Application folder. Find the MapBusinessOnline folder in the Start Menu scrollbar. Click the folder’s dropdown arrow and choose the MapBusinessOnline option.
The Map App includes the Map Viewer app for free non-subscriber map sharing.
Please read customer reviews or review us at Capterra, or g2crowd
Contact: Geoffrey Ives geoffives@spatialteq.com or Jason Henderson jhenderson@spatialteq.com