Market Analysis
- Extend your marketing tools with easy-to-use yet powerful business mapping software. No need for a complex GIS. Just import a spreadsheet and go!
- Add geographic and demographic components to your market analysis. Access high quality commercial map data for accurate analysis, including USPS ZIP Codes.
Identify New Markets

Identify and explore potential markets for your organization. Justify franchise investments.
Site Selection

Overlay your business data, demographic variables, and business listings to select the best location for expanding your business.
Competitor Analysis

Discover how competitor locations affect your trade areas.
Create Map Visualizations from Marketing Data

Easily import location-based business data - customers, prospects, competitors, and resources.
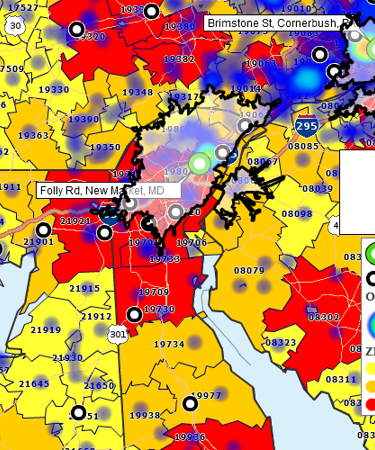
Create thematic market analysis maps of existing and potential business areas.
Share illuminating business maps with constituents for decision-making and planning.
Leverage US Census Bureau Demographic Data

Develop ZIP Code, county, and city demographic profiles that expose untapped opportunities.
Balance and assign franchise and sales territories by most relevant demographic categories. Map important population segments and consider consumer expenditure trends.
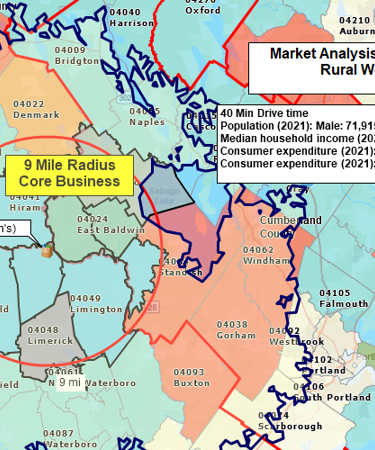
Perform Radius and Drive Time Calculations

Enhance marketing analysis and campaign planning with radius maps and driving time and distance calculations.
Create multiple sales territories based on radius or drive time searches in one pass.
Summarize demographic characteristics by radius, drive time area, or ZIP Code groupings.
Find, Map & Export Business Listings

Search by industry, area, city, ZIP Code, or state. Export downloaded data for external use.
Overlay business listing competitors, prospects, and resources into your market analysis maps.
Color-code business listings based on firmographics – sales, employee, and branch information.
Learn How Our Customers are Succeeding with MapBusinessOnline
The Alternative Board (TED), an advisory board creation service for business of all types and sizes, used MapPoint to import customer locations, create and manage territories, and for visual market analysis. When MapPoint left them high and dry, they began looking for a MapPoint replacement. This process led them to MapBusinessOnline.
Over a period of a few weeks MapBusinessOnline shared several online web demo that showed exactly how MapBusinessOnline would replace and improve upon the mapping technology TED had become used to. The Alternative Board recently renewed their Map Business Online subscription for another year.
The Alternative Board

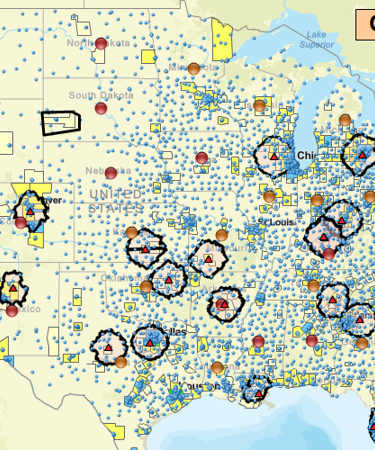
This leading national footwear brand manufacturer uses MapBusinessOnline to conduct retail coverage assessments nationwide. They loved MBO’s ability to provide both street level detail and USA wide high level views of points-of-sale. Importing location enabled address databases for symbolization and color shading is easy. New and planned stores can be added to the map market analysis as products are launched and mature.
"Importing location enabled address databases for symbolization and color shading is easy."
Todd Eichelberger
Sales Director
Adidas

MVP Sports Clubs is a sports and health facility management and development company with operations in Central Florida and West Michigan. MVP uses MapBusinessOnline to construct demographic map profiles of a radius surrounding each of their many sports clubs. Such market analysis helps MBO users develop a better understanding of their business which makes strategic planning more effective.
"MBO users develop a better understanding of their business which makes strategic planning more effective."
Mark Hope
Business Manager
MVP Sports