
MapBusinessOnline business mapping software includes access to an entire library of Census demographic data. This data can be used to develop thematic maps based on demographic topics, summations, and calculations using multiple categories – including ethnicities.
In this example, MapBusinessOnline answers, ‘In a defined area, what are the Black and Hispanic portions, as a percentage, of the total population?’
Political analysis of populations is used to enhance polling indications, voter canvassing planning, and perhaps just political planning in general. Understanding the details behind an area’s total population can benefit various analyses. I imagine a political newbie considering a run for a Senate or Representative seat might want a handle on what ethnicities make up the electorate they are messaging.
Sales and Marketing professionals also seek to understand population breakdowns as they consider launching campaigns supporting large retailers or political action groups. All those issue-based direct mail pieces we throw away at home are not cheap. Great for starting a woodstove fire, though.
City and county planning offices like to monitor population shifts to maintain relative equity across neighborhoods. As rougher neighborhoods become more gentrified or vice versa, city elected officials are responsible for treating citizen homeowners and renters fairly, without creating ‘Red Zones’ or gated communities for the well-to-do.
The professionals mentioned above need an easy and fast way to gather that information. The data should be available for large areas, as extensive as a state, and for small areas, as small as ZIP codes or even Census tracts. Fortunately for you, affordable MapBusinessOnline is here with just the ticket.
A subscription to MapBusinessOnline business mapping software includes access to Census demographic data. The list of categories is comprehensive and consists of the following:
- Overall population estimates as well as significant ethnicity breakdowns.
- Household and median income levels.
- Household totals, as well as head of household estimates.
- Age breakdowns by populations.
- Income breakdowns by population.
- Major consumer expenditures.
- Home ownership and rental estimates.
- Many more categories, too numerous to list here.
Use Calculated Data Columns to Combine Demographic Categories or Create Simple Formulas.
Determining the Ethnicity Population Breakdown
Step 1 – Choose your area of interest.
We will be using MapBusinessOnline’s territory mapping tool to develop our breakdown. Territory management software is excellent for many applications, including sales territory creation, service territory management, franchise territory management, and, in our case, market and demographic analysis.
Areas of interest can vary widely. In your business, someone will ask for a relevant area – a five-mile radius around a major population center. A customized polygon might be appropriate for more wonky areas with known lopsided population anomalies.
- Once an area is targeted, choose your polygon or radius option from the Search Tools on the Master Toolbar, and draw the area.
- Use the Search option in the associated popup menu to search for the list of ZIP codes bounded by your map object. (ZIP codes are the most popular alignment layer for demographic analysis.)
- Save that result as a Territory with a name that means something relevant to your project.
Note: Any map object on the map can be searched for ZIP codes (or counties, Census tracts), but the resulting ZIP codes won’t match the exact area of a circle or polygon. Considering that Census demographic results are always an estimate, in most cases, the results are good enough. However, the map creator does have the option, in Map and Data – Map Options, to adjust the extent of ZIP code/Area overlap.
Click – Map Options – Edit Search Options. Click the dropdown to explore the intersection options – Intersect – Intersect at least 50% – Fully inside. These adjustments would impact spatial queries with any map layer intersection – ZIP code, State, County, or City Limit.
Create A Calculated Data Column
Back to our story.
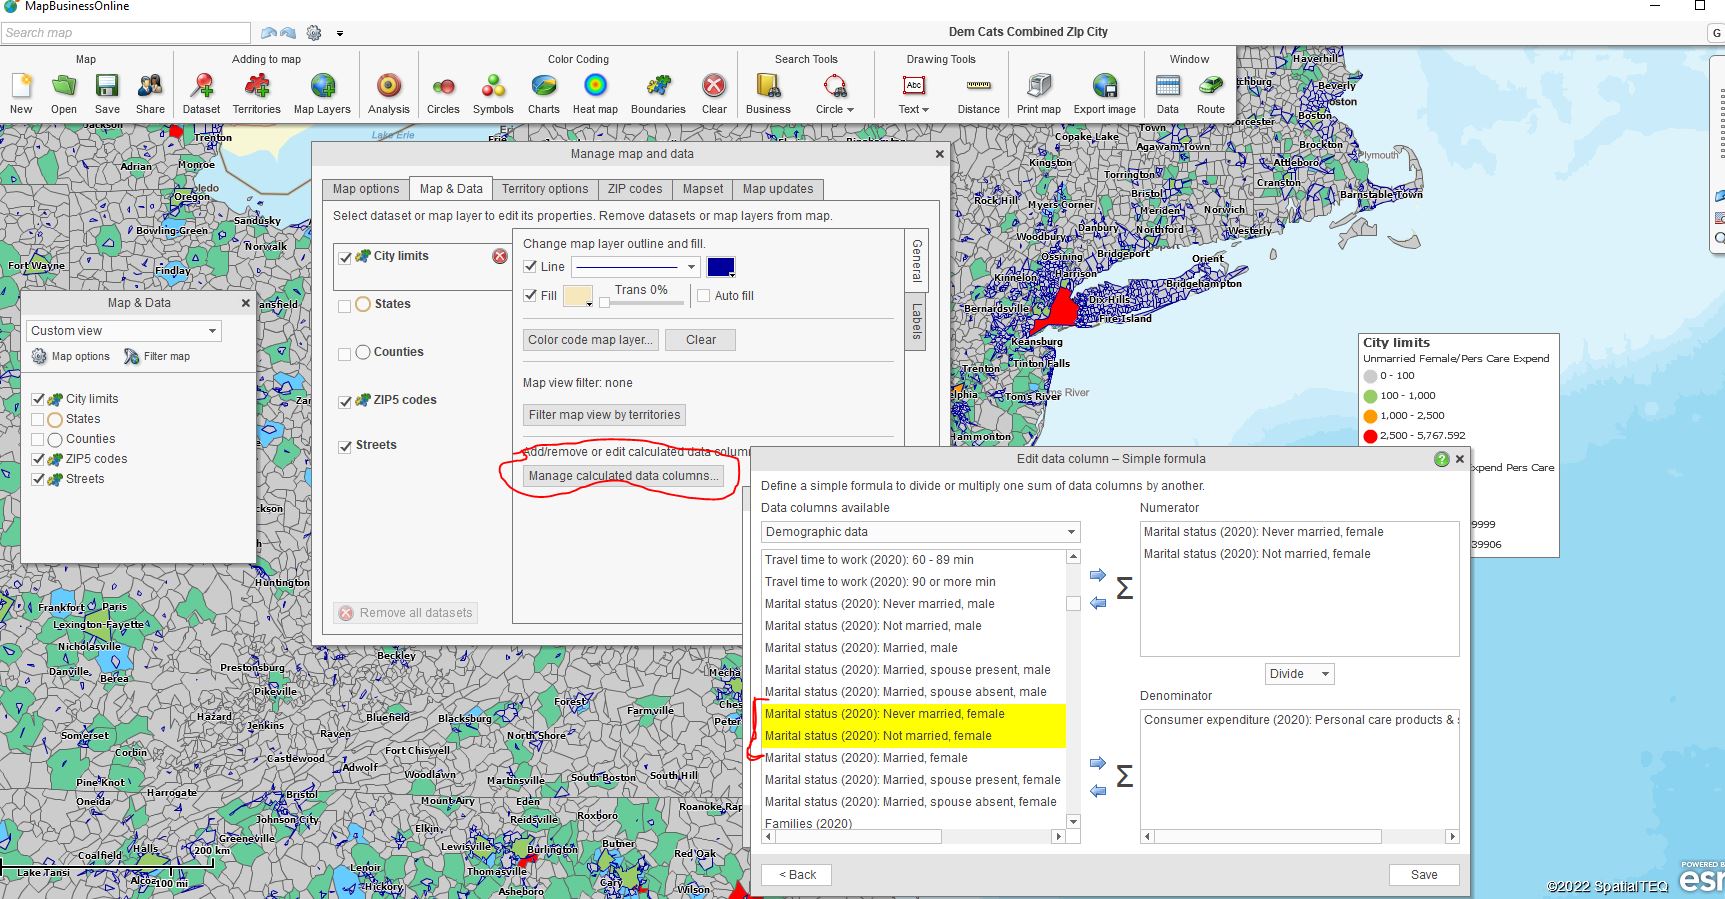
With your territory assigned, we must develop a Calculated Data Column with a formula for percentages applicable to the two ethnicities within the total population.
- Go to Map and Data. Because we used ZIP codes as our alignment layer, Click into the ZIP code layer. Select Calculated Data Columns – the bottom option.
- Click Add Data Column. Name the Column – ‘% Black & Hispanic.’ (Your choice.) For format, in this case, select ‘Percentage.’ Set numbers or decimals as required.
- Click Formula Options and Simple Formula.
- Next is the Demographic Data selection process.
- Because it is a % of the total population, move the Total ‘Population (2021)’ to the right as the Denominator.
- Move the ethnicity populations you’re interested in (Black & Hispanic) to the right as the Numerator. (Isn’t using Denominator and Numerator labels at work fun? 4th Grade math.)
- Click ‘Add’ in the lower right. Your formula is now created as a Calculated Data Column and is accessible in the Data Window analysis view.
Return to the Data Window and drop down to your Territory.
- In the lower right, click Choose Columns.
- On the left side of the two-sided database tool that opens, drop down to the Calculated option for pulling data into the analysis. Find your Calculated Data Column named dataset. Move it to the right side.
- If it suits your project, you can drop down to Demographic Data and move various Demographic categories into the analysis. For instance, Pacific Islanders may represent only .5 percentage points of the total population, but listing that population segment may add value to your analysis.
- Click Set Data Columns.
Take a look at your territory in the Data Window. You now have ethnicity categories noted by percentage. High-fives all around.
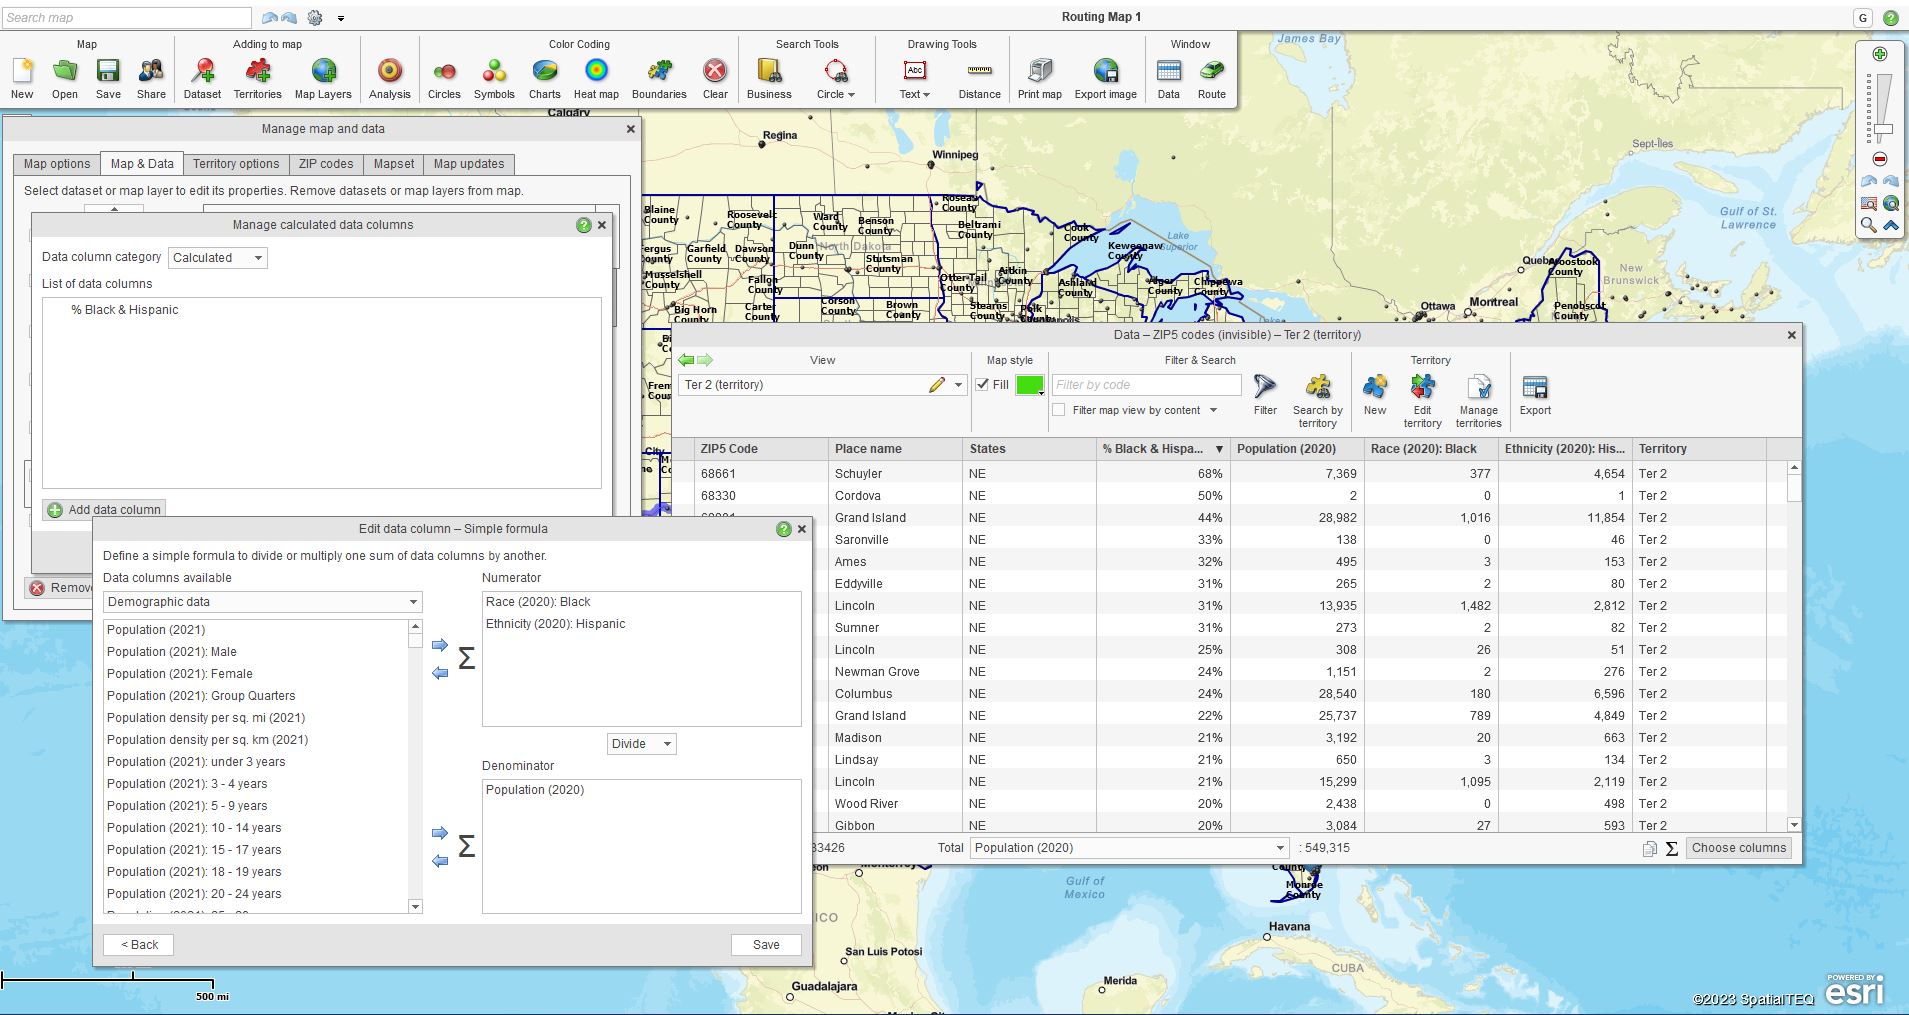
Calculated Data Columns formula for analyzing % of the population.
The Results – Reporting on Your Demographic Analysis
Once your demographic analysis of the ethnicity percentage of the total population is complete, you have several options for reporting:
- Use MapBusinessOnline – the software, via a web share meeting or an overhead projector. Once you’re familiar with the tool, you will find using it as a live-sharing tool advantageous.
- You’ll have more flexibility to turn layers on and off as part of the presentation.
- To answer questions, you could quickly upload more categories of demographic data live.
- You’ll become known as the company Map Geek. (This cuts both ways.)
- The Data Window tabular view of demographic information, including your formula results, is exportable. Use the right-most button on the Data Window toolbar to export to a CSV file.
I think the above exercise in demographic mapping is an excellent example of how MapBusinessOnline provides advanced analysis capabilities for everyday businesspeople. The tool is both easy-to-use and affordable. And you get to use the terms Denominator and Numerator without having to apply to SpaceX for a trip to Mars.

Captain Numerator and Lieutenant Denominator relax at the Martian landing site – 2036 – while Private Dividend records. (SpaceX Image.)
_______________________________________________
Discover why over 25,000 business users log into www.MapBusinessOnline.com for their business mapping software and advanced sales territory mapping solution. The best replacement for Microsoft MapPoint happens to be the most affordable.
To access MapBusinessOnline, please register and download the Map App from the website – https://www.mapbusinessonline.com/App-Download.aspx.
After installing the Map App, the MapBusinessOnline launch button will be in the Windows Start Menu or Mac Application folder. Find the MapBusinessOnline folder in the Start Menu scrollbar. Click the folder’s dropdown arrow and choose the MapBusinessOnline option.
The Map App includes the Map Viewer app for free non-subscriber map sharing.
Please read customer reviews or review us at Capterra or g2crowd.
Contact: Geoffrey Ives at geoffives@spatialteq.com or Jason Henderson at jhenderson@spatialteq.com.