Customer Mapping Software
Learn All You Can about Your Existing and Future Customers through the Power of Location
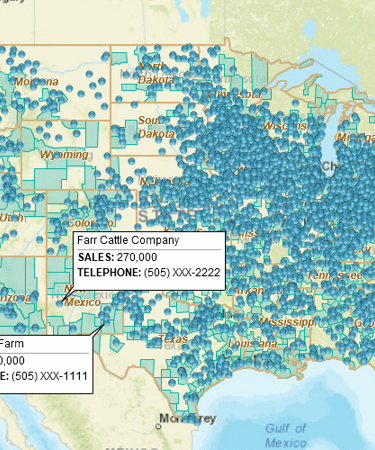
- View existing customers and potential leads on a map for all of your sales and marketing efforts. Plot customer locations by street address, city name, ZIP code, postal code or latitude and longitude — in the US and Canada.
- Easily import customer data from CRM, accounting packages like Intuit QuickBooks, text files, CSV files, or Microsoft® Excel spreadsheets. Plot up to 250,000 locations per map at one time.
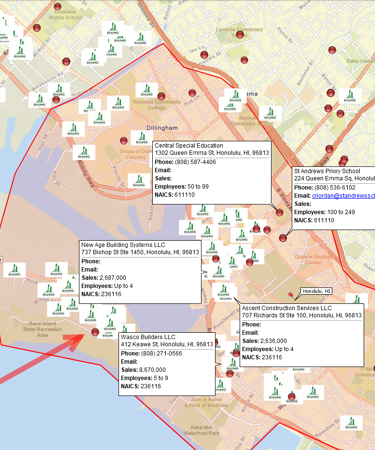
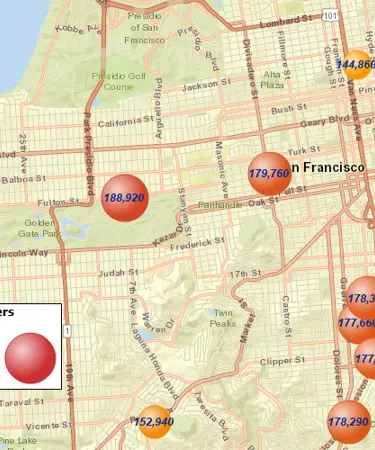
- MapBusinessOnline's visualization tools make it easy to diagram customer locations in support of sales efforts. Use a large collection of map symbols to identify and segment customers on a map, add your own symbols. Customize map information boxes to include customer’s name, address, phone number and other business and CRM data.
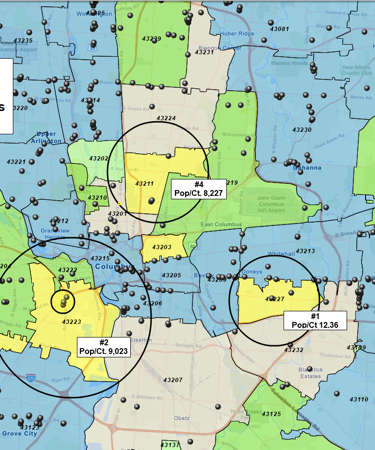
- Plan your direct mail strategy and prepare for site visits. Run geographic queries of your customer list by radius or drive time.
- Conduct market analysis. Build data maps that reveal trends and compare sales, population, income and other demographic variables.
- Plan your sales trips with our easy-to-use route optimization software, generate turn-by-turn directions.
- Share maps through MapBusinessOnline interactive webmap sharing, image sharing or print.
Choose MapBusinessOnline Customer Mapping Because:
- MapBusinessOnline provides unsurpassed power of all customer mapping tools you may need in one app. Don’t waste your time with limited-feature competitor programs which you will overgrow quickly.
- We allow the most customer location points per map for less money with a 98% success rate.
- We have No daily customer plotting limits unlike many other online customer mapping tools.
- MapBusinessOnline also features the most intuitive territory mapping tools available and shared map editing.
Customer Mapping
Businesses in all industries go to great lengths to get to know their customers better — to understand what a typical customer looks for and needs, and deliver a higher caliber of service. Too often, however, these efforts rely on speculation and received wisdom rather than hard facts. As a result, businesses find it difficult to break out of their old habits and embrace innovation.
MapBusinessOnline's customer mapping tools help you take a more data-driven approach to marketing. The platform allows you to place raw sales and demographic data in a geographical context that is ideal for visualizing where and who your customers are. From there, you can allocate resources more effectively, and make smarter strategic decisions that will ultimately help grow your customer base in sustainable ways.
Benefits of Customer Mapping
The main benefit of customer mapping is that it turns information you already have into map visualizations that can help you uncover new and powerful insights. For example, without a customer map, your sales data is just a collection of names, dates, amounts and addresses — useful for telling you the bottom line, but little else. To allocate resources and plan for future expansion, you need to know more. A customer map can show you where your customers are clustered, and which areas are currently underserved. With this big picture view, you will run more effective marketing and sales campaigns that reach both those who have supported your business in the past and potential new customers. Customer map visualization is used to build demographic profiles of your best performing areas and match them with new areas around the nation.
Customer mapping is also useful for site selection for future expansion, as well as route optimization, if you provide on-site services. Many businesses use customer maps to overlay their sales history with demographic data to gain insights into their customer base. Finally, customer maps are excellent visuals aids for presentations to upper management when justifying new projects or initiatives — use MapBusinessOnline to create striking map visualizations that make your point clearly and cater to your specific map audience.
Working With Customer Mapping Software Data
Customer location mapping starts with your data — whether it's in an Excel spreadsheet or CSV file, or exported from CRM, QuickBooks or another program. MapBusinessOnline gives you the flexibility to work with data from across multiple platforms.
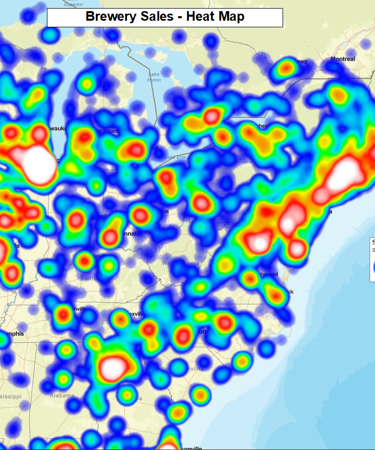
Once you have imported your data into MapBusinessOnline, you can use tools such as heat mapping and radius mapping to discover areas of high customer density, assign custom sales territories that make the best use of your team, and create delivery routes that efficiently get your technicians where they need to go.
Uncover Your Market Potential
MapBusinessOnline offers a fast and accurate customer mapping solution to uncover your market potential all across the U.S. and Canada. MapBusinessOnline has a simple user interface that can quickly turn your Excel database sheets into a compelling map of your customer base.
Spatially search your existing customers using radii, polygon or drive time search tools. Color-code records and display sales results by ZIP code, county, city, and state. Access demographic information and create smart customer profiles. Determine the optimum location for your next direct mail, email, and or call-out sales campaigns. There’s no better way to map customer data and optimize your next marketing campaign.
Smart Targeting With Customer Mapping
MapBusinessOnline customer mapping software accesses the latest Census data to give you a detailed demographic perspective when segmenting and targeting all of your potential leads. View demographic data by zip code, county, state, Census Tract and more. Break down maps on multiple demographic themes targeting areas that best fit your businesses by:
- Age
- Commute Times
- Education
- Employment
- Ethnicity
- Gender
- Households
- Housing units
- Income
- Occupation
- Race
- Religion
- Rent
- Vehicle Data
Go Deeper With Demographic Layers
MapBusinessOnline takes customer location mapping software to the next level with demographic data layers. Access current U.S. Census records, as well as datasets from third-party analytics firms, to give your customer maps additional context. With MapBusinessOnline, you can look at factors such as average age, household size, income, property values and more. This helps you get to know your current and potential customers better and target your marketing and sales efforts more effectively.
Collaborate and Share Information with MapBusinessOnline
MapBusinessOnline lets you share customer mapping results with all of your sales & marketing teams, so everyone can access the important data layers relevant to their specific work. Your CMO can create and control a central map template for all of your current campaigns and share secure versions with designated marketing team members, which helps you deliver just the right information to your team so they can communicate clearly with your customers.
MapBusinessOnline is a cloud-based program that gives users the option of assigning editing privileges to remote collaborators. As a result, sharing information and working together on big projects is easy, even for franchises with customer data coming from multiple locations.
All customer location maps are printable and exportable to standard formats like PDF and JPG. More than just a tool for planning, customer location maps make sure your team has access to the information they need to do their jobs right. They're also highly effective presentation aids when delivering a proposal to upper management.
Industry Applications
Any business that relies on sales can benefit from MapBusinessOnline's customer mapping tools. Whether you sell your product face-to-face or over the internet, MapBusinessOnline can help you turn raw data into actionable intelligence which will ultimately help grow your business.
Specific industries using MapBusinessOnline to map their customers include banking and finance, insurance, manufacturing, real estate, retail, service industries, telecommunications, trades, and utilities, and more. Keep browsing the MapBusinessOnline website to explore the potential of this advanced, intuitive tool.
Where Your Competitors Aren’t
You’re a smart business. You have a unique understanding of where your customers are and where your competitors are strongest. By choosing MapBusinessOnline and its customer mapping software, you can visualize these markets and look for potential inroads into competitor sales territories — or find communities that aren’t being served yet.
Turn your Excel database into a tactical advantage that can be quickly and securely shared with everyone from delivery drivers to the C-Suite. Use customer mapping to improve your bottom line – achieve optimum customer and prospect location awareness for your sales & marketing teams.
MapPoint & BusinessMAP Alternative Seekers: You’ll find MapBusinessOnline has greatly improved upon your standard mapping feature set. In addition to outstanding territory mapping tools, map data is regularly updated, geocoding is much more consistent and successful, color-coding and symbolization options are excellent, and the overall user experience is much easier.
Get Started with MapBusinessOnline Today
MapBusinessOnline is one of the most affordable programs of its kind, with multiple subscription options for businesses of any size, in any industry. Ready to get started?
See MapBusinessOnline in Action
Request a demo
Learn How Our Customers are Succeeding with MapBusinessOnline

"In a large company, with many layers of sales teams, sales management, territories, operations teams and distribution, it is vital to have a solution to quickly and easily display country and regional maps. I have tried multiple other mapping solutions in the past only to be frustrated by their limitations or by their complexity. MapBusinessOnline perfectly fits my need. MBO has the versatility to allow me to build somewhat complicated maps but also allows me to knock out the quick, one-off request. MBO continues to add features and I am excited to see what new features come out next."
Dave Perek
Sr Business Analyst
Schneider Electric


"I just wanted to say thank you for this amazing mapping tool! I've tried a number of sales territory map solutions and this is by far the best. I just (finally!) switched over from MapPoint and this is so much better, I wish I had switched sooner. Your videos and blog are also really helpful, though most things I have figured out on my own. It looks like I also have a lot more to discover as I explore the data visualization tools. Thanks again!"
Andrea Harrison
Business Analyst
Brainlab, Inc.

"This software is a game changer for me in the workplace. Easy to use tools and a fast system to do the job efficiently and effectively every time. I’ve been able to build more territories with confidence, bringing my team more growth opportunities for 2019"
Daina C.
Franchise Development Manager
Amada Franchise, Inc.

Popular MapBusinessOnline features
Build fast map visualizations of your business data

Map business data from various sources by street address, city name, ZIP code, or latitude and longitude. Plot 250,000 or more locations on a map at once. All you need to start is a spreadsheet with business data.
Visualize business data on map with various symbols

Assign specific symbols, colors, and sizes to your data points on map. Choose from a wide variety of symbols or create your own. Visually define customers and prospects across multiple locations using symbols color coding.
Emphasize customers density with heat maps

Highlight market areas that generate more business. Visually compare map areas for business potential. Select from a variety of heat map colors and options.
Illustrate business data on map with charts

Graphically depict your business data on a map using pie or bar charts. Use charts to show sales by product, invoices due vs. paid, products ordered vs. shipped, and sales by customer demographics.
Label your business data using flexible callouts

Show more than one callout on map at a time. Add notes to individual map callouts. Change callouts orientation for better map layouts. Customize callouts look & feel.
Display business data against demographic maps

Categorize geographic areas by population or household income. Explore new markets, business patterns, or social trends against color coded Census maps for business and competitor analysis.
Share business maps

Create interactive maps and share with friends, colleagues, dealers, customers, prospects or vendors. Share territory maps. Email saved JPEG and PNG files or embed map files in PowerPoint presentations. Includes PDF export for larger print formats.
Print large format map views

Print large maps to use in presentations and project plans. Save maps as PDF files to print as large as 60” x 60” customer maps. Supports multiple pages option to use your home or office printer for large wall maps.
Search data spatially with radius maps

Explore your data within circle or polygon areas. Organize search results into marketing lists or market areas. Export ZIP code demographics, territories, or marketing lists in Microsoft® Excel spreadsheets.


