
So, you’ve created a basic business map. You’ve downloaded the Map App and accessed MapBusinessOnline from the Windows Start Menu or MAC Applications folder. Then you imported an address-based or latitude longitude-based spreadsheet and developed a map that pertains to your business in some way. Your associates were impressed, but could you do more? Could you enhance your first business map’s imported business data with symbolization in the map view?
Symbolizing Your Imported Business Data
A recent COVID-19 Death map might benefit from a heat map enhancement. We get our COVID-19 data from USA Facts.org. As of late, more counties are suffering from an expanding death rate, unfortunately. With the data already imported, a heat map, similar to a weather map, is easily achieved. MapBusinessOnline heat mapping works like this:
- In Map and Data make sure the imported COVID Deaths point layer is selected
- Select the Heat Map button under the Color-code section on the Master Toolbar
- Select your imported Death data layer and drop down to the appropriate column
- Choose a color scheme and move the scroll bar to an acceptable level of intensity
- Click Done
- Repeat the process to try various schemes
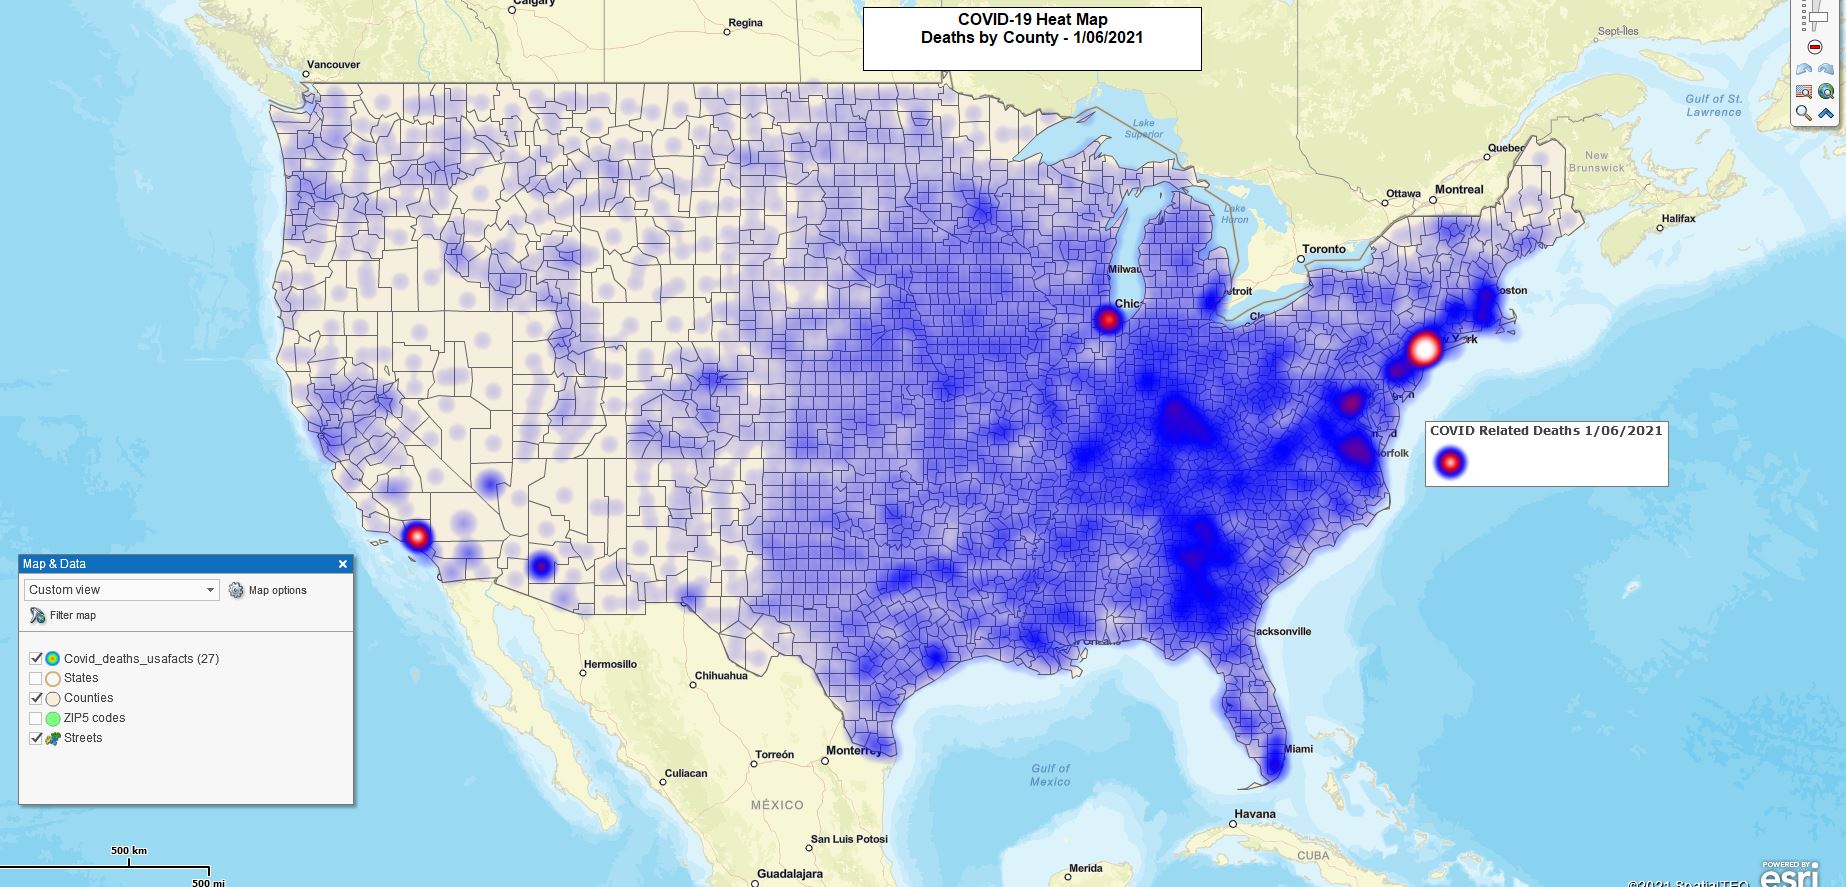
COVID-19 Deaths Heat Map
One could also color code the counties or states by the same imported dataset. ZIP code color coding would not work in this case because the dataset happens to reflect deaths by County. Color-coding imported data by ZIP code or county is sometimes referred to as a “heat map.”
Heat Map by Administrative District
Using the same map, I unchecked the point layer in Map and Data to get rid of the heat map view. Here is what I did next:
- Chose the Color Code Boundary option on the Master Toolbar
- I selected the County Map Layer
- I selected my data and chose the most recent death data column by date
- I set up a 5-range color code theme. I believe 5 ranges are appropriate for the data subject at hand
- I manually assigned a numbering scheme to each of my five ranges. Beginning with 1 to 100, and ending with 5,000 to 11,071. Choose your own numeric ranges
- I did select the prefabricated yellow-to-orange color gradated color option. But then I inserted some of my own color choices to enhance the gradated scale and color the highest deaths a bright red
- I clicked done in the Color-code process.
- I also edited my legend to explain the color scheme and I closed the Master Toolbar and Map and Data to create a pure map image
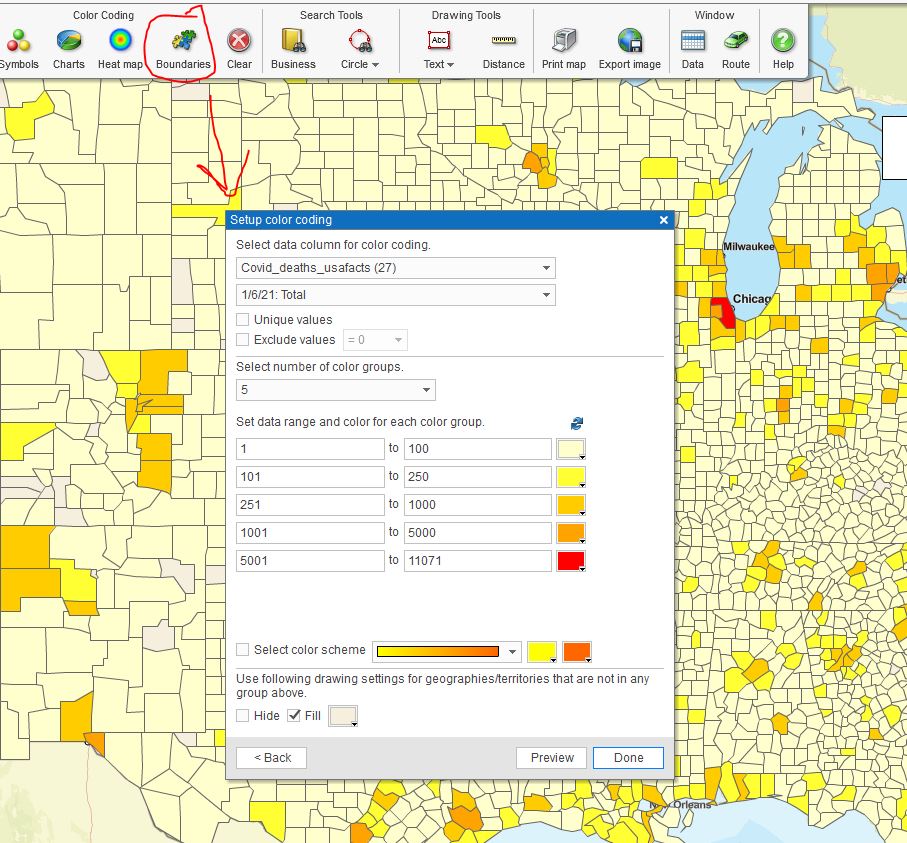
Setting up color ranges
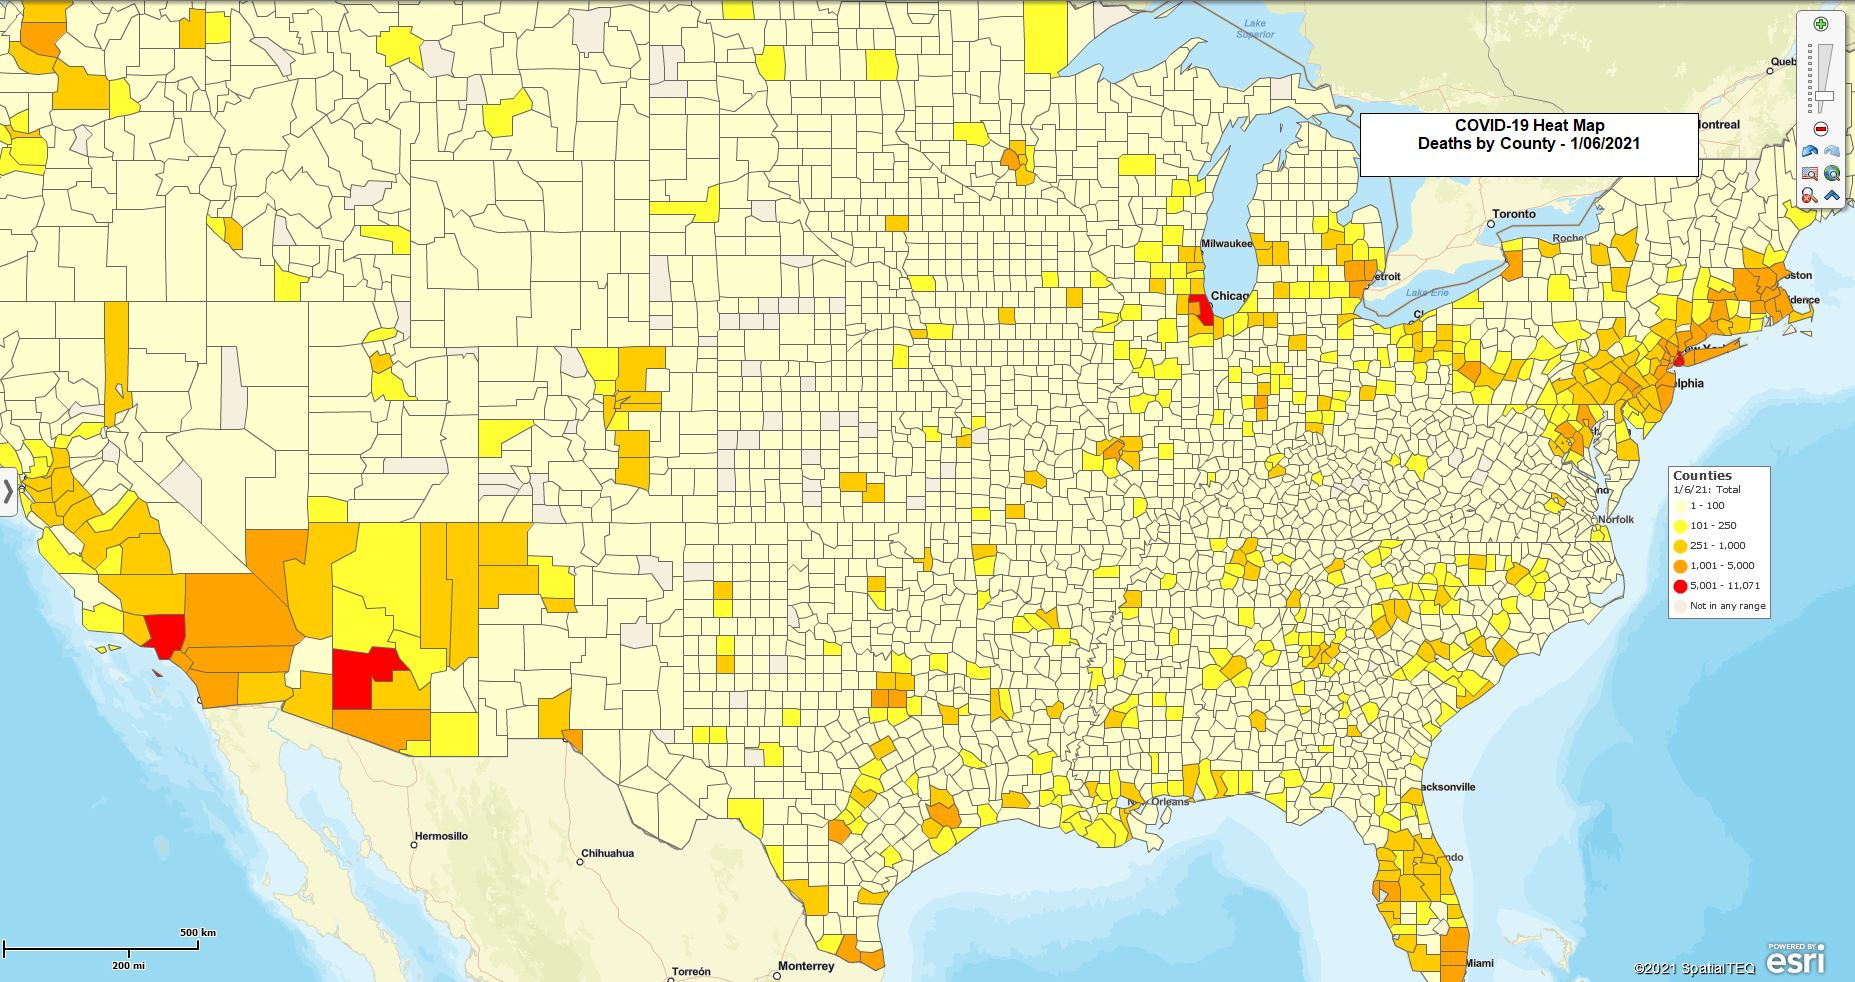
COVID Deaths by County
Color-Code by Circle
Another valuable approach to symbolizing your imported location data is by circle symbols. MapBusinessOnline lets you apply a circle symbol to a numeric column of your data and then tweak that symbol to show the numeric value, associate a color scheme, apply a 3D symbol and apply a border color to that symbol. This all serves to include a numeric value within a color-coded circle at each point location.
- With your imported data layer checked on in Map and Data, select the Circle Color Coding button under Color Coding on the Master Toolbar
- Select your imported data layer
- Select the Map Layer to apply (in this case counties)
- Choose the column of numeric data targeted for symbolic display
- Apply the varying controls to your symbol’s look and feel
- Select a color scheme and 3-D
- Choose a border color and pixel width
- Tweak the minimum and maximum sizes for the circles related to numeric values
- Finally, set the overall numeric text value size, boldness, and color. Also, choose a box outline option, if you want that
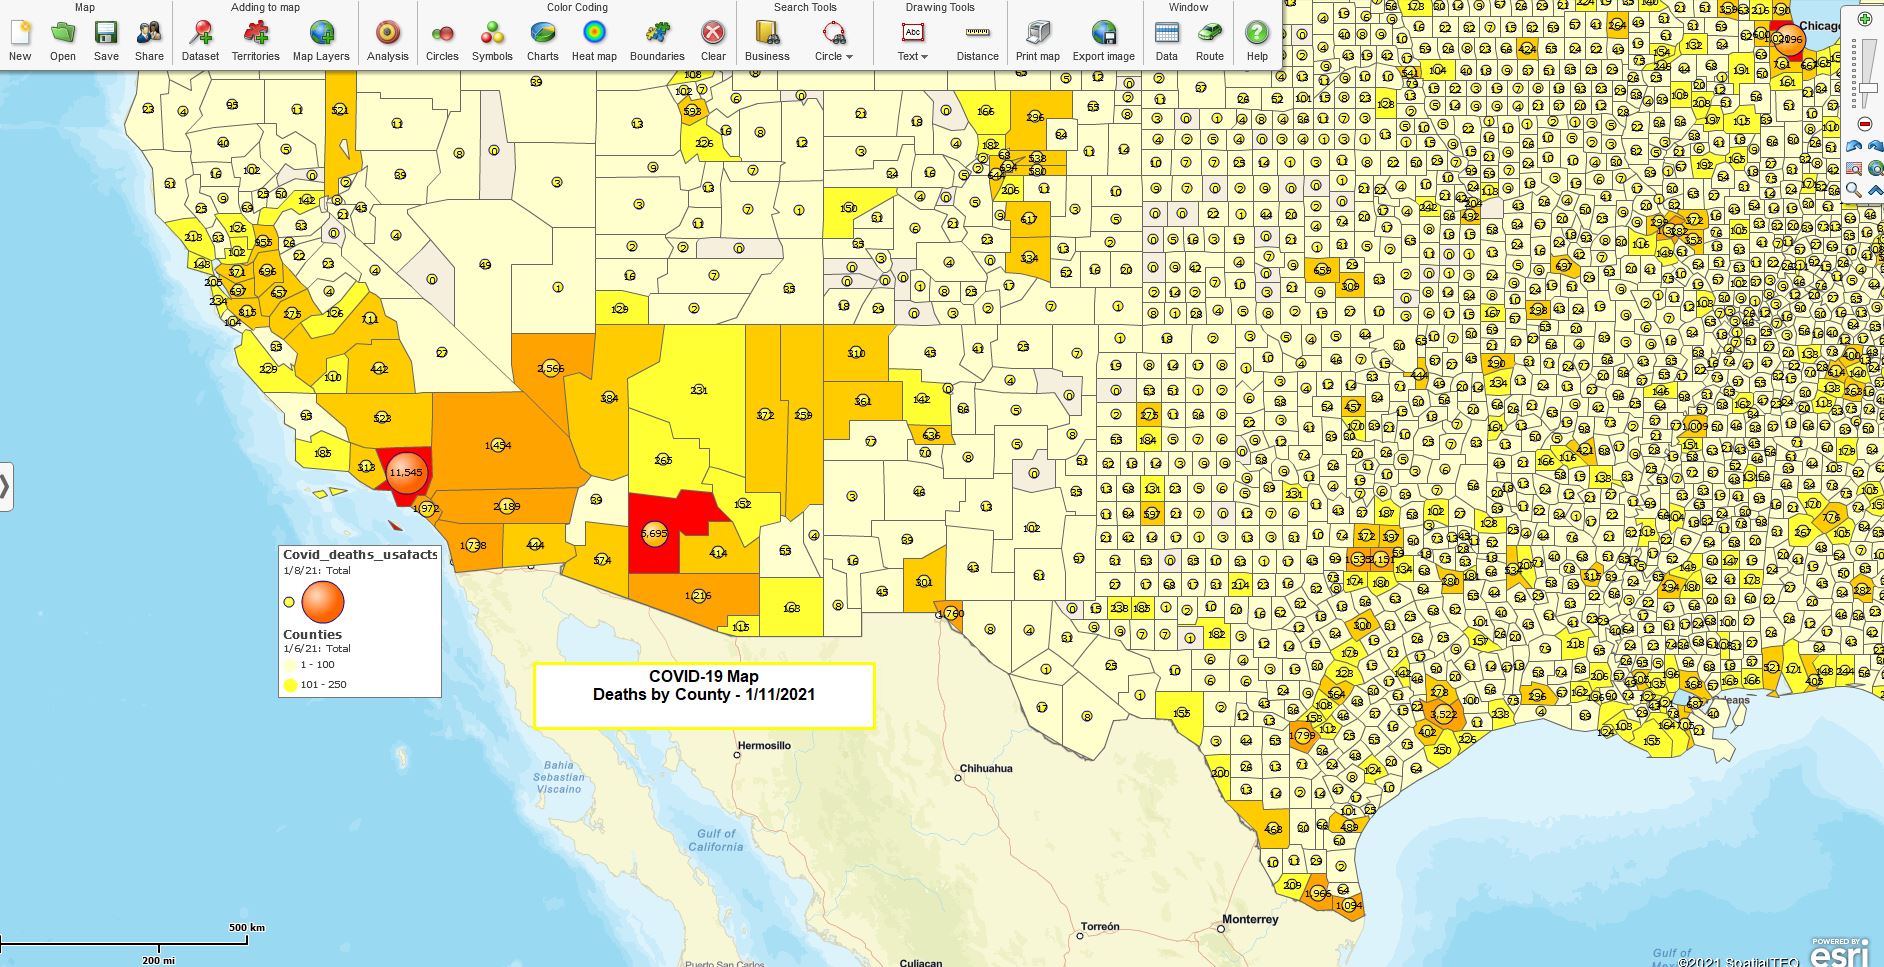
Color code by circle map view
Remember to keep things simple and clear when selecting symbol options.
As you can see, there are many options for adjusting your map image to create a better visualization of a business, medical, or tactical situation using location data. But MapBusinessOnline also provides an analysis view through the Data Window.
Click the Data Window button on the right side of the Master Toolbar. This action opens up a spreadsheet view of the map. The Data Window includes its own toolbar. On the far-left side of the data window toolbar is a dropdown list. That drop-down accesses data available for the map user to work with.
Select the imported data layer in the drop-down list. Now the Data Window displays the spreadsheet you imported. In the lower right of the Data Window view, you will see the Change Columns button. Read more about the Chang Columns button here.
Click the Change Column button and a database management tool opens up. On the left side of the database management tool click the drop-down to access the data available for import into your analysis view.
You can add imported location data, data from other map layers, demographic data, and even calculated data columns that display basic formula results and demographic category summations.
Probably the most powerful map enhancement you can bring to bear on a MapBusinessOnline business map is importing multiple categories of demographic data to the Data Window analysis view. Here’s a map view of the map we’ve been working with showing the Data Window and a demographic Summary insert from a polygon search of counties.
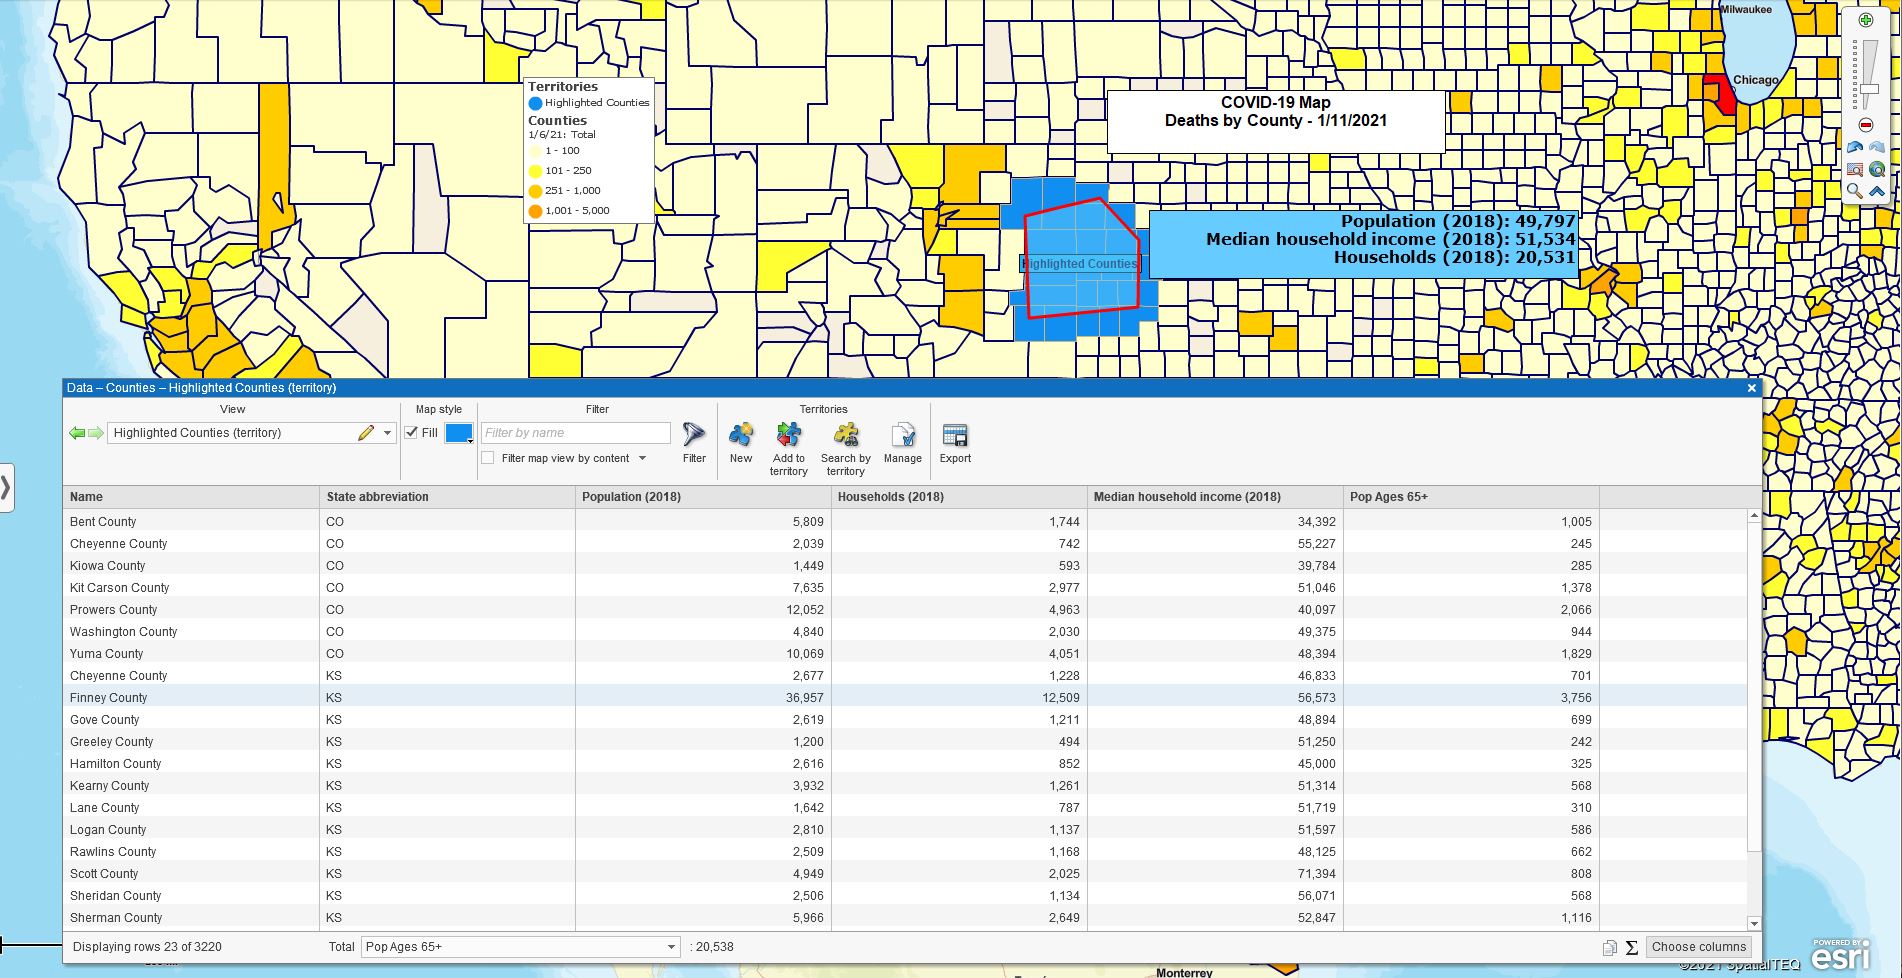
County COVID Deaths – data options
Once you’ve created your first basic business map, there are a variety of directions you can take to enhance your map. Always keep it simple, remember your map audience and your map’s purpose, and you can’t go wrong.
_______________________________________________________
Find out why over 25,000 business users log into www.MapBusinessOnline.com for their business mapping software and advanced sales territory mapping solution. The best replacement for Microsoft MapPoint happens to be the most affordable.
To access MapBusinessOnline, please register and then download the Map App from the website – https://www.mapbusinessonline.com/App-Download.aspx.
After installing the Map App, the MapBusinessOnline launch button will be in the Windows’ Start Menu or Mac Application folder. Find the MapBusinessOnline folder in the Start Menu scrollbar. Click the folder’s dropdown arrow and choose the MapBusinessOnline option.
The Map App includes the Map Viewer app for free non-subscriber map sharing.
Please read customer reviews or review us at Capterra, or g2crowd
Contact: Geoffrey Ives geoffives@spatialteq.com or Jason Henderson jhenderson@spatialteq.com