
Map creators and viewers can visualize any location dataset imported into MapBusinessOnline in multiple ways. Let’s explore the possibilities for map visualization using MapBusinessOnline business mapping software.
User data could be imported or created using several data formats and subjects. Formats might include:
- Address spreadsheets – Columns for Address | City | State |ZIP code
- Latitude and Longitude coordinates – Lattitude 09899, Longitude 71.7714
- Text files as long as the addressing has separate component columns.
Map creators could also create location-based datasets using these map business online features:
- Business Listings search and download tools. Read more on Business Listings here.
- Incremental ‘add a location with a callout’ placement using the address bar or draw tool point placements.
- Calculated Data Columns, a feature that builds data columns by combining data through formulas. Read more here.
Once data has been imported or created, the dataset will display as location points on the map. The dataset will also appear in two other vital MapBusinessOnline functions:
- Map and Data – Notice datasets listed in this floating checkbox. Turn datasets on and off with the click of a mouse. Read more about Map and Data.
- The Data Window – Here, imported and created datasets display in tabular formats, like an Excel sheet within MapBusinessOnline. Filter, symbolize, export, and copy your data from the Data Window. The data window also provides the powerful Choose Columns function in the lower right of the user’s screen for database management and access to Demographic Data.
Map Visualizations Come in Many Shapes, Colors, and Sizes.
Map Visualizations of Your Data
Maps present data to map viewers. Map data is symbolized – represented on the map by a point or another symbol from the MapBusinessOnline symbol library.
Note: You can import your symbols using the Color Code by Symbols tool.
By ‘visualization,’ we mean creating symbolized, color-coded, and geographically organized views of your map data. MapBusinessOnline provides an array of tools to highlight your datasets to complement and support your map’s purpose.
Note: Always seek to create color-shaded and highlighted visualizations that are easy on the eyes and not obnoxious or distracting to the map viewer. Overdoing visualization through bright colors or too prominent symbols can detract from your map’s purpose.
MapBusinessOnline visualization tools include:
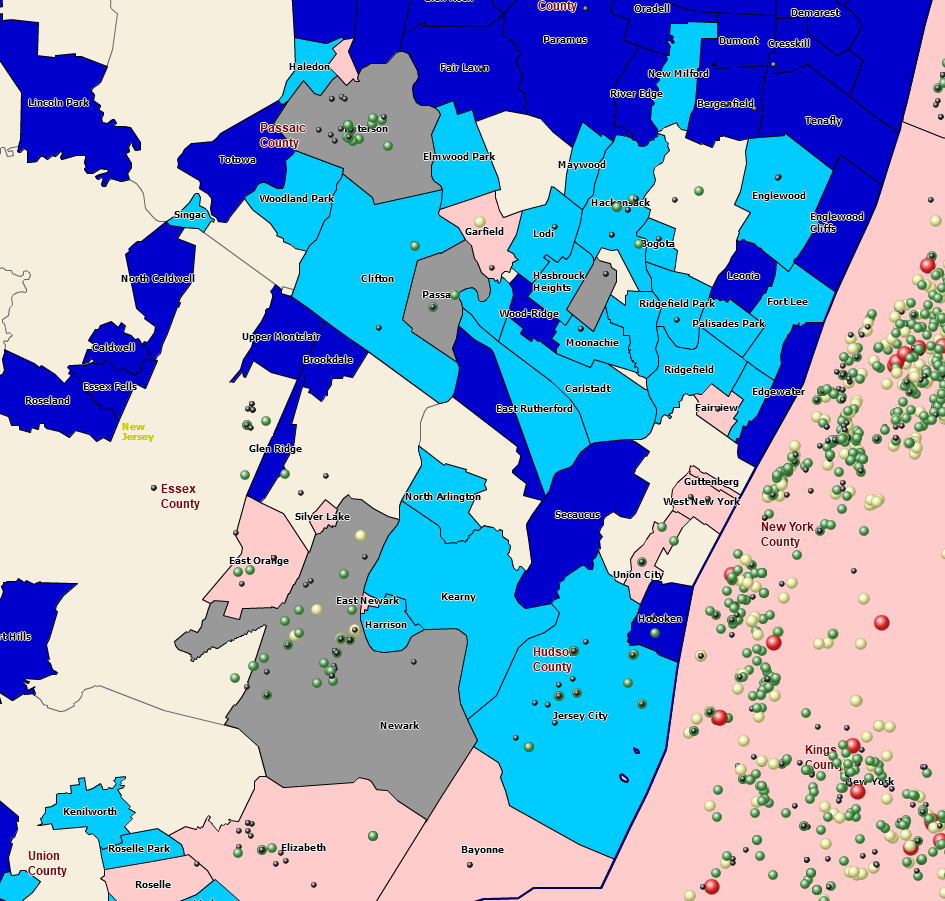
Color-code Point Layers – Great for plot density maps and defining types and numeric ranges by color or symbol size.
Color-code by Boundaries or Map Layers – Color-code City Limits, 5 and 3-digit ZIP codes, Counties, and Census tracts by imported data columns or demographic data. Read more about color-coding by Boundaries.
Heat Map – Sometimes, numeric values of imported data reflect monetary transactions. Sales activities will show up more frequently in more urban areas or areas with more retail outlets. Heat maps covert point location data into hot and cold spots on the map. Heats show the intensity of sales activity.
Symbolize with Charts and Graphs – Use charts and graphs to display year-over-year comparisons or similar subjects with variable data.
Color-code Using Circles – Circle color-coding enables numeric display on each point. Color-code by Circle provides a more nuanced, targeted data message to map viewers.
Use Draw Tools to Highlight Areas
In addition to color-coding dataset symbols on the map, a map creator can also use MapBusinessOnline draw tools to highlight specific areas or sections of the map—for example, a dataset of convenience stores plots to show points along a highway. A polygon shape with color could further highlight those retail stores chased fill.
Color-shaded polygons, circles, or drive-time areas emphasize imported map layers and areas of interest.
Map Layer Enhancements
For further map enhancement, consider adding a map layer. City limits boundaries define urban areas and town jurisdictions. Use other additional map layers that might be relevant to your map’s purpose:
- ZIP codes – Demographic visualizations related to real estate, zoning, or politics. ZIP code maps can also be based on imported data – another kind of heat map.
- Counties and Congressional Districts – Apply these for election results, law enforcement, or political statements.
- States – Use for broad, general map reporting. We used states to show COVID spread during the pandemic.
Like map layer objects such as ZIP codes are easily combined in MapBusinessOnline to show territories or areas of interest. The most popular map layer for such an approach is ZIP5 codes, ZIP3 codes, counties, and city limits.
In MapBusinessOnline, territories, and areas of interest connect the map object view with database analysis, the core power of business mapping software. With territories comes the ability to analyze imported data against demographic and geographic data. Suddenly your area of interest becomes very interesting.
Note: C-suite Executives love business analysis.
Use your map objects and map layers wisely. Follow these general map creation rules, and your map may become more than just a customer map or route suggestion:
- Stay focused on your map’s business purpose.
- Do not clutter your map with superfluous map objects and data.
- Avoid bright and oversized map symbols.
- Don’t try to solve all business problems with one map.
- Save important map work as a My Template map to protect it from overwriting.
- Show your map to a colleague for feedback before you take it to a meeting.
- Spell-check your map text and relabel imported layers to connect them to your map’s purpose.
Follow these words of map wisdom, and you’ll know when it’s time to get that Map Geek tattoo on your arm, leg, or back. Just don’t clutter the tat.
_______________________________________________
Discover why over 25,000 business users log into www.MapBusinessOnline.com for their business mapping software and advanced sales territory mapping solution. The best replacement for Microsoft MapPoint happens to be the most affordable.
To access MapBusinessOnline, please register and download the Map App from the website – https://www.mapbusinessonline.com/App-Download.aspx.
After installing the Map App, the MapBusinessOnline launch button will be in the Windows Start Menu or Mac Application folder. Find the MapBusinessOnline folder in the Start Menu scrollbar. Click the folder’s dropdown arrow and choose the MapBusinessOnline option.
The Map App includes the Map Viewer app for free non-subscriber map sharing.
Please read customer reviews or review us at Capterra or g2crowd.
Contact: Geoffrey Ives at geoffives@spatialteq.com or Jason Henderson at jhenderson@spatialteq.com