
Last week a multi-user, team subscription customer contacted us to ask for advice. EverCare Medical (a fake name) said they had a list of roughly 1,000 ZIP codes that represented a group of new clients in their three-state area. They needed to assure their new customer that the EverCare Service Network had store locations within 20 miles of most of these ‘new clients.’
My contact wanted to know if and how MapBusinessOnline Could provide that critical information. To make it easier for my customer, I asked to review the data, and I set up the query myself. Below is a description of what I did.
MapBusinessOnline Pro Market Analysis Tool
Comparing two datasets is a task for the MapBusinessOnline Market Analysis tool – the orange and yellow target icon currently located seven buttons in from the left. This is an advanced application of business mapping software. We’ll be focusing on Market Analysis (MA). MA views the Service Network as “store locations.” MA views the New Client data as “customers.”
Market Analysis is available only for MapBusinessOnline Pro subscribers.
Learn More About MapBusinessOnline Pro Market Analysis
Review & Import Your Data
Always take a moment to review your Excel or CSV spreadsheet before import. In this case the data itself was fine. I noticed one client with the ZIP code missing but it was in Canada which was out of scope for this analysis because the Service Network is focused on Iowa and Nebraska.
I did notice the client spreadsheet was nationwide with thousands of addresses and it had labeling and descriptive info taking up the top few lines of the spreadsheet. MapBusinessOnline won’t like that, so I deleted those narrative lines and saved my data to a folder on my desktop.
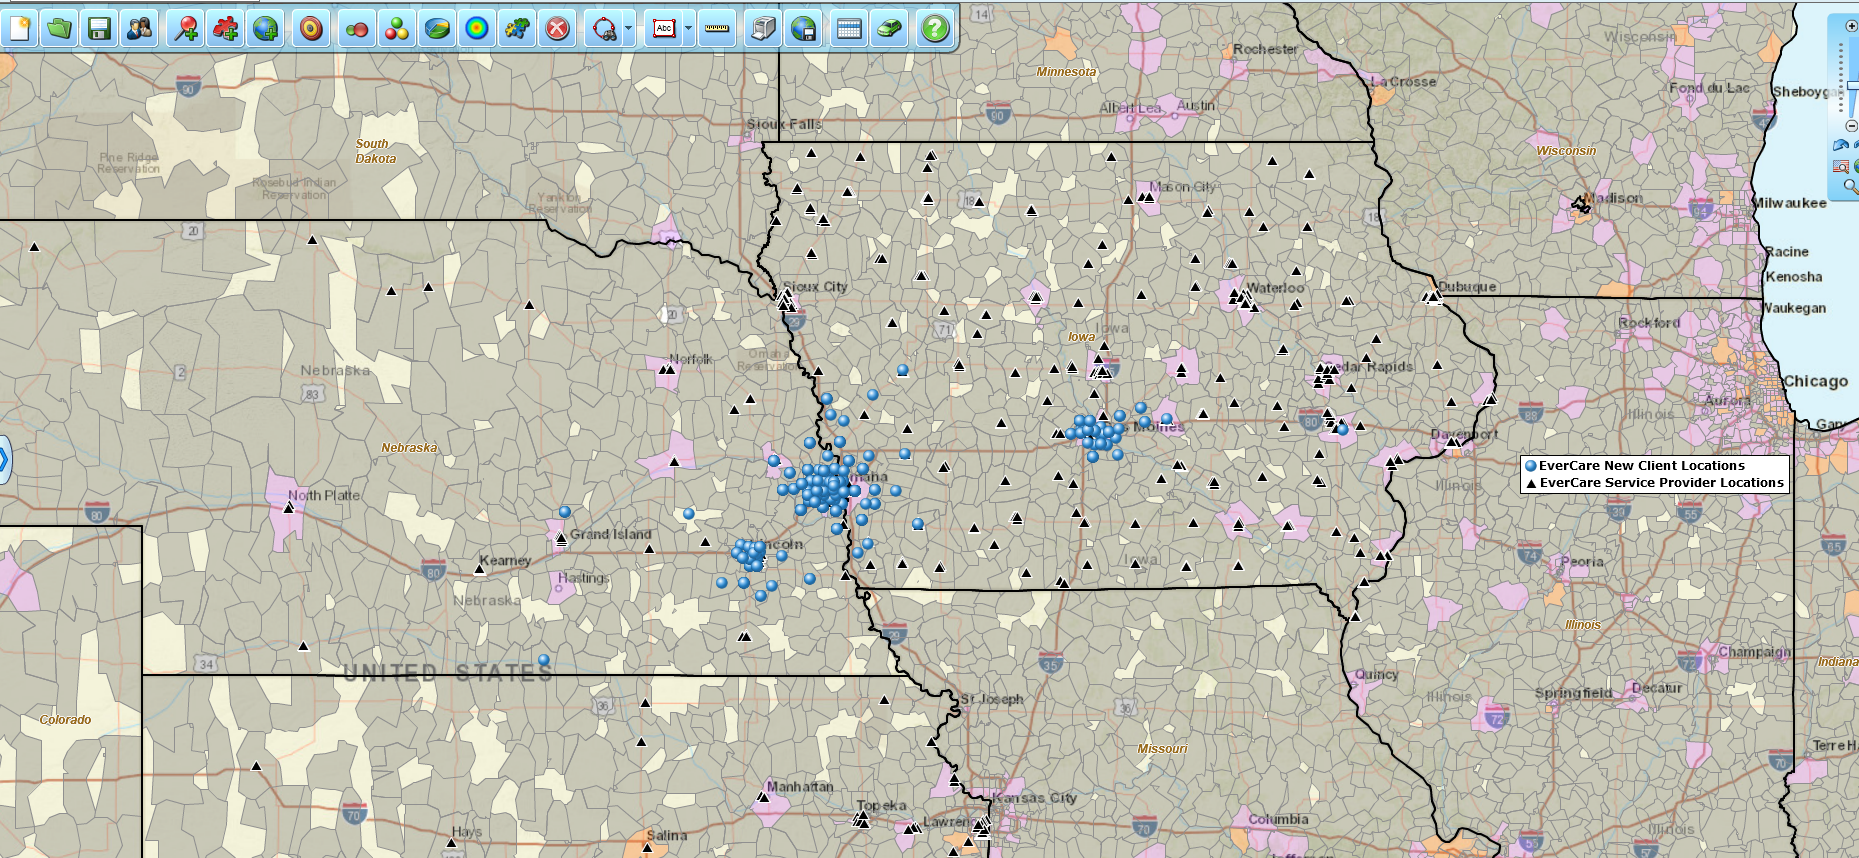
Next, using MapBusinessOnline Pro I imported both the client and service network data sheets and gave each set a unique symbol sized, at between 25 and 30% for easy identification on my map. I used black triangles for the service centers and blue dots for the clients. I like simple yet clearly differentiated symbols on my maps. I keep them just big enough be clearly visible and not clutter the map. “I hate map clutter.” – Lou Grant.
Filter Service Location Data
Because we’re focusing on only three states, I needed to filter the EverCare Service Locations data down by state. In the Data Window, I selected the new client data and hit the Filter Button (funnel icon). I chose to Filter by State and used a ‘One Of’ modifier on the left side of the filter entering IA, KS, and NE. I clicked Filter and got 574 filtered records. I then clicked the Create New Marketing List icon and named my new layer and clicked Filter Data on the Map in the upper right to limit the clients shown on the map to my three-state area. The filtered data shows as a subset of my original import.
At this point, a quick visual assessment of the map tells me that EverCare has great coverage for this project.
Running Market Analysis
With my data layers established and filtered, I clicked the Market Analysis tool. One could use the first or second option for this kind of query. But the first analysis puts circles on up to 200 locations records and my target was 574 locations so, I chose the second analysis option – “Find the Nearest Store or Pick-up locations.”
In the analysis set-up, I chose EverCare New Clients as the customer locations, and I chose EverCare Service Locations in IA, KS, NE as the store location data. Note: this was a drop down underneath the parent service location layer. I was sure to look for the little drop option to find the subset data layer I had filtered and saved. I input 20 miles as the distance requirement and I set a data sheet view label for the service locations. I kept the ‘number of nearest stores’ at quantity 1. A user could search for up to 5 nearest stores based on the options. I then processed the query by clicking Next.
The processed results became visible in the Data Window view of the EverCare New Client list. There is now a Distance to EverCare Srvc Locations column. The records that display “-1” fall outside the 20-mile limit. By clicking the top of the columns a few times and you will sort the data and see only records outside the limit.
There was only one client outside the 20 mile limit. Problem solved.
Steps Outlined using MapBusinessOnline Pro:
- Import the spread sheet of client ZIP codes
- Import a spreadsheet of Service Provider addresses
- Filter the Provider list by state
- In the Data Window select the Service Provider list
- Click the Filter Button
- Choose to Filter by State, Modify the Search in the upper right choosing “One of” and typing in IA, NE, KS
- With the resulting 574 records in the Data Window click the Create New or Existing Marketing List button and save as a Subset of Providers (Providers IA, KS, NE)
- Check the Filter Data on Map box in the upper left of the Data Window to just show those local providers
- Select the Market Analysis Tool
- Choose number 2 of the five options
- Select EverCare Clients as “customer locations
- Select Subset Service Provider list as Store Locations
- Set the distance at 20 miles
- Enter Text as EverCare Provider Locations
- The result lists of all the Clients and their distances to the closest provider. In the Data Window select your EverCare Clients again
- Those Clients at greater than 20 miles show a result distance of “-1.”
MapBusinessOnline Pro Market Analysis has additional tools. Read more about the differences between Standard and Pro:
Now back to Maine, I think spring arrives this afternoon…
_______________________________________________
MapBusinessOnline access has officially transitioned from Web Browser (Adobe Flash Player) access to the Map App download access.
- Please download the Map App from the website – https://www.mapbusinessonline.com/App-Download.aspx.
- After installing the Map App, the MapBusinessOnline launch button will be in the Windows’ Start Menu or Mac Application folder. Find the MapBusinessOnline folder in the Start Menu scrollbar. Click the folder’s dropdown arrow and choose the MapBusinessOnline option. You can drag the icon to the taskbar for a quick launch button.
- All saved maps will be available through your Map Library Folder, the second button in from the left on the Master Toolbar. (Green File Folder icon.)
Map App access to MapBusinessOnline.com provides enhanced features and a better user experience.
The Map App includes the new Map Viewer app for free non-subscriber map sharing.
Value-Added Resellers – Offer the tool to your customers as a reseller. Make money on training and consulting. Contact us with further interest in reselling MapBusinessOnline.
Find out why over 25,000 business users log into www.MapBusinessOnline.com for their business mapping software and advanced sales territory mapping solution. The best replacement for Microsoft MapPoint happens to be the most affordable.
Please read customer reviews or review us at Capterra, or g2crowd
Contact: Geoffrey Ives geoffives@spatialteq.com or Jason Henderson jhenderson@spatialteq.com