
Affordable and Accessible Business Mapping Can Help
Business mapping software makes it easy to plot customer and sales location data against an accurate map for business analysis. Overlayed with historical sales data, digital maps will display where your company does business well or poorly. By analyzing the areas where you do business, a sales or marketing map user discovers what works and doesn’t. These market analysis maps explain why a particular area works better than another.
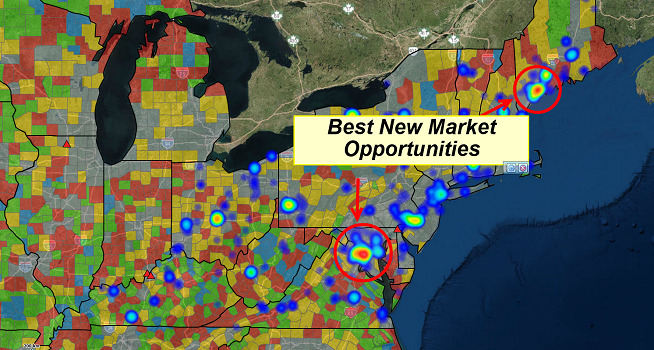
Concentrated sales activity will appear on the business map either as densely populated customer location points (density maps) or as a bright color intensity layer, often referred to as a heat map. These high-density areas depict where sales transactions are happening. Color-coded ZIP codes, counties, or city limit layers display Census demographic information associated with each jurisdiction. That demographic data suggests why products or services do well in some areas and not others.
One basic assessment is Census population estimates by ZIP code. A ZIP code with one hundred thousand people will generate sales for more products or services than a ZIP code with one hundred people – unless you’re selling bags of refuse, the results will be similar.
Examples of more definitive statistics that could be added to the analysis:
• The population of Hispanic adults per ZIP code.
• The population of females per ZIP code.
• The population of people ages sixty-five through ninety per ZIP code.
• Households with income greater than $100,000.
• 2020 Consumer Expenditures related to hair products.
The available options for demographic analysis within Map Business Online are many and growing. If your selling products like hot sauce, hair nets, or pain medications, these statistics will be relevant to your business analysis. Supplement your research further by importing industry location data you can access or explore MapBusinessOnline business listings.
Build a ZIP Code Profile
With a group of ZIP codes within a region identified as an active source of revenue for a product or service, the sales organization will have established several critical pieces of business intelligence:
• Products that sell well within ZIP codes with distinct demographic characteristics.
• The optimum demographic categories for best sales results.
• The customer industry types for best sales results.
• Sales channels and paths to market that are working.
Business mapping software will expose business intelligence simply by importing address-based spreadsheets of customer and prospect activity and viewing the resulting demographic map. Enlightened by these sales results, sales and marketing professionals conduct a map-based search for similar areas. It’s a filtering process designed to expose those ZIP codes that reflect the optimum demographic makeup. Show me all the ZIP codes with these three criteria:
• Greater than (>) 20,000 Hispanic residents
• Greater than (>) 18,000 Females
• ZIP codes with the highest ratio of Household Income/Households
Generally, test campaigns will be applied to gauge market viability. The resulting ZIP codes are color shaded to determine where the market regions with the most potential are located. Decisions will be made around which regions make the most sense to try next. Perhaps all of them, but it will depend on sales and marketing resources covering each area.
Replicating sales success from one region to another using MapBusinessOnline.
Find Sales Leads
The next step is to define specific business prospecting targets in your targeted regions. These will be selected within ZIP codes and by Industry Type.
By testing customers and prospect accounts across multiple regions you will gain sales intelligence, answering questions such as:
• Are the areas with similar demographic makeup performing as expected?
• How are customers reacting to the products or services offered?
• What new regional patterns are becoming obvious?
It’s possible that product colors that sell well in New England do not sell as well in Florida or California – where the beautiful people live. I’m being facetious, there are several beautiful people in New England, but geographic and demographic patterns will emerge.
Business mapping software is an affordable and accessible platform for identifying well-performing markets and then replicating that success in other areas. Don’t get left behind.
_______________________________________________
Discover why over 25,000 business users log into www.MapBusinessOnline.com for their business mapping software and advanced sales territory mapping solution. The best replacement for Microsoft MapPoint happens to be the most affordable.
To access MapBusinessOnline, please register and download the Map App from the website – https://www.mapbusinessonline.com/App-Download.aspx.
After installing the Map App, the MapBusinessOnline launch button will be in the Windows Start Menu or Mac Application folder. Find the MapBusinessOnline folder in the Start Menu scrollbar. Click the folder’s dropdown arrow and choose the MapBusinessOnline option.
The Map App includes the Map Viewer app for free non-subscriber map sharing.
Please read customer reviews or review us at Capterra or g2crowd.
Contact: Geoffrey Ives at geoffives@spatialteq.com or Jason Henderson at jhenderson@spatialteq.com.