Sales Mapping Software
Benefits of Affordable Sales Mapping in MapBusinessOnline
- Create a map of customers, leads, sales reps.
- View sales by location or geographical area (ZIP code, county, state, etc.).
- Get visual insights into sales performance through color coding or heat maps – by sales, product type, etc.
- Display sales trends for multiple years or products with bar charts or pie charts.
- Query your customer list by radius, polygon, or drive time.
- Generate leads using business listings data.
- Design and manage sales territories.
- Plan optimized sales routes.
- Share sales maps and data with team members.
Create a Map of Customers
All you need to plot your customers, leads, or sales reps on a map is an Excel spreadsheet with names and addresses. MapBusinessOnline allows for the import and plotting of hundreds of thousands of locations at a time on a geographical map in a matter of minutes. With MapBusinessOnline you can plot your data by street address, city name, ZIP code, postal code, or latitude and longitude — in the US and Canada.
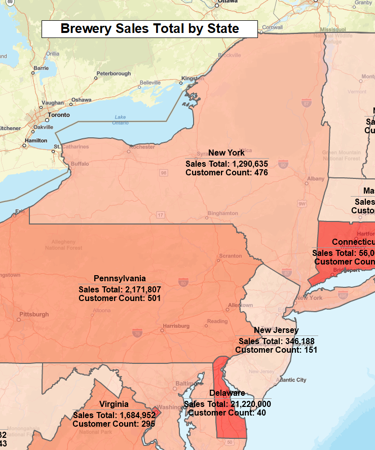
View Sales by Location or Area
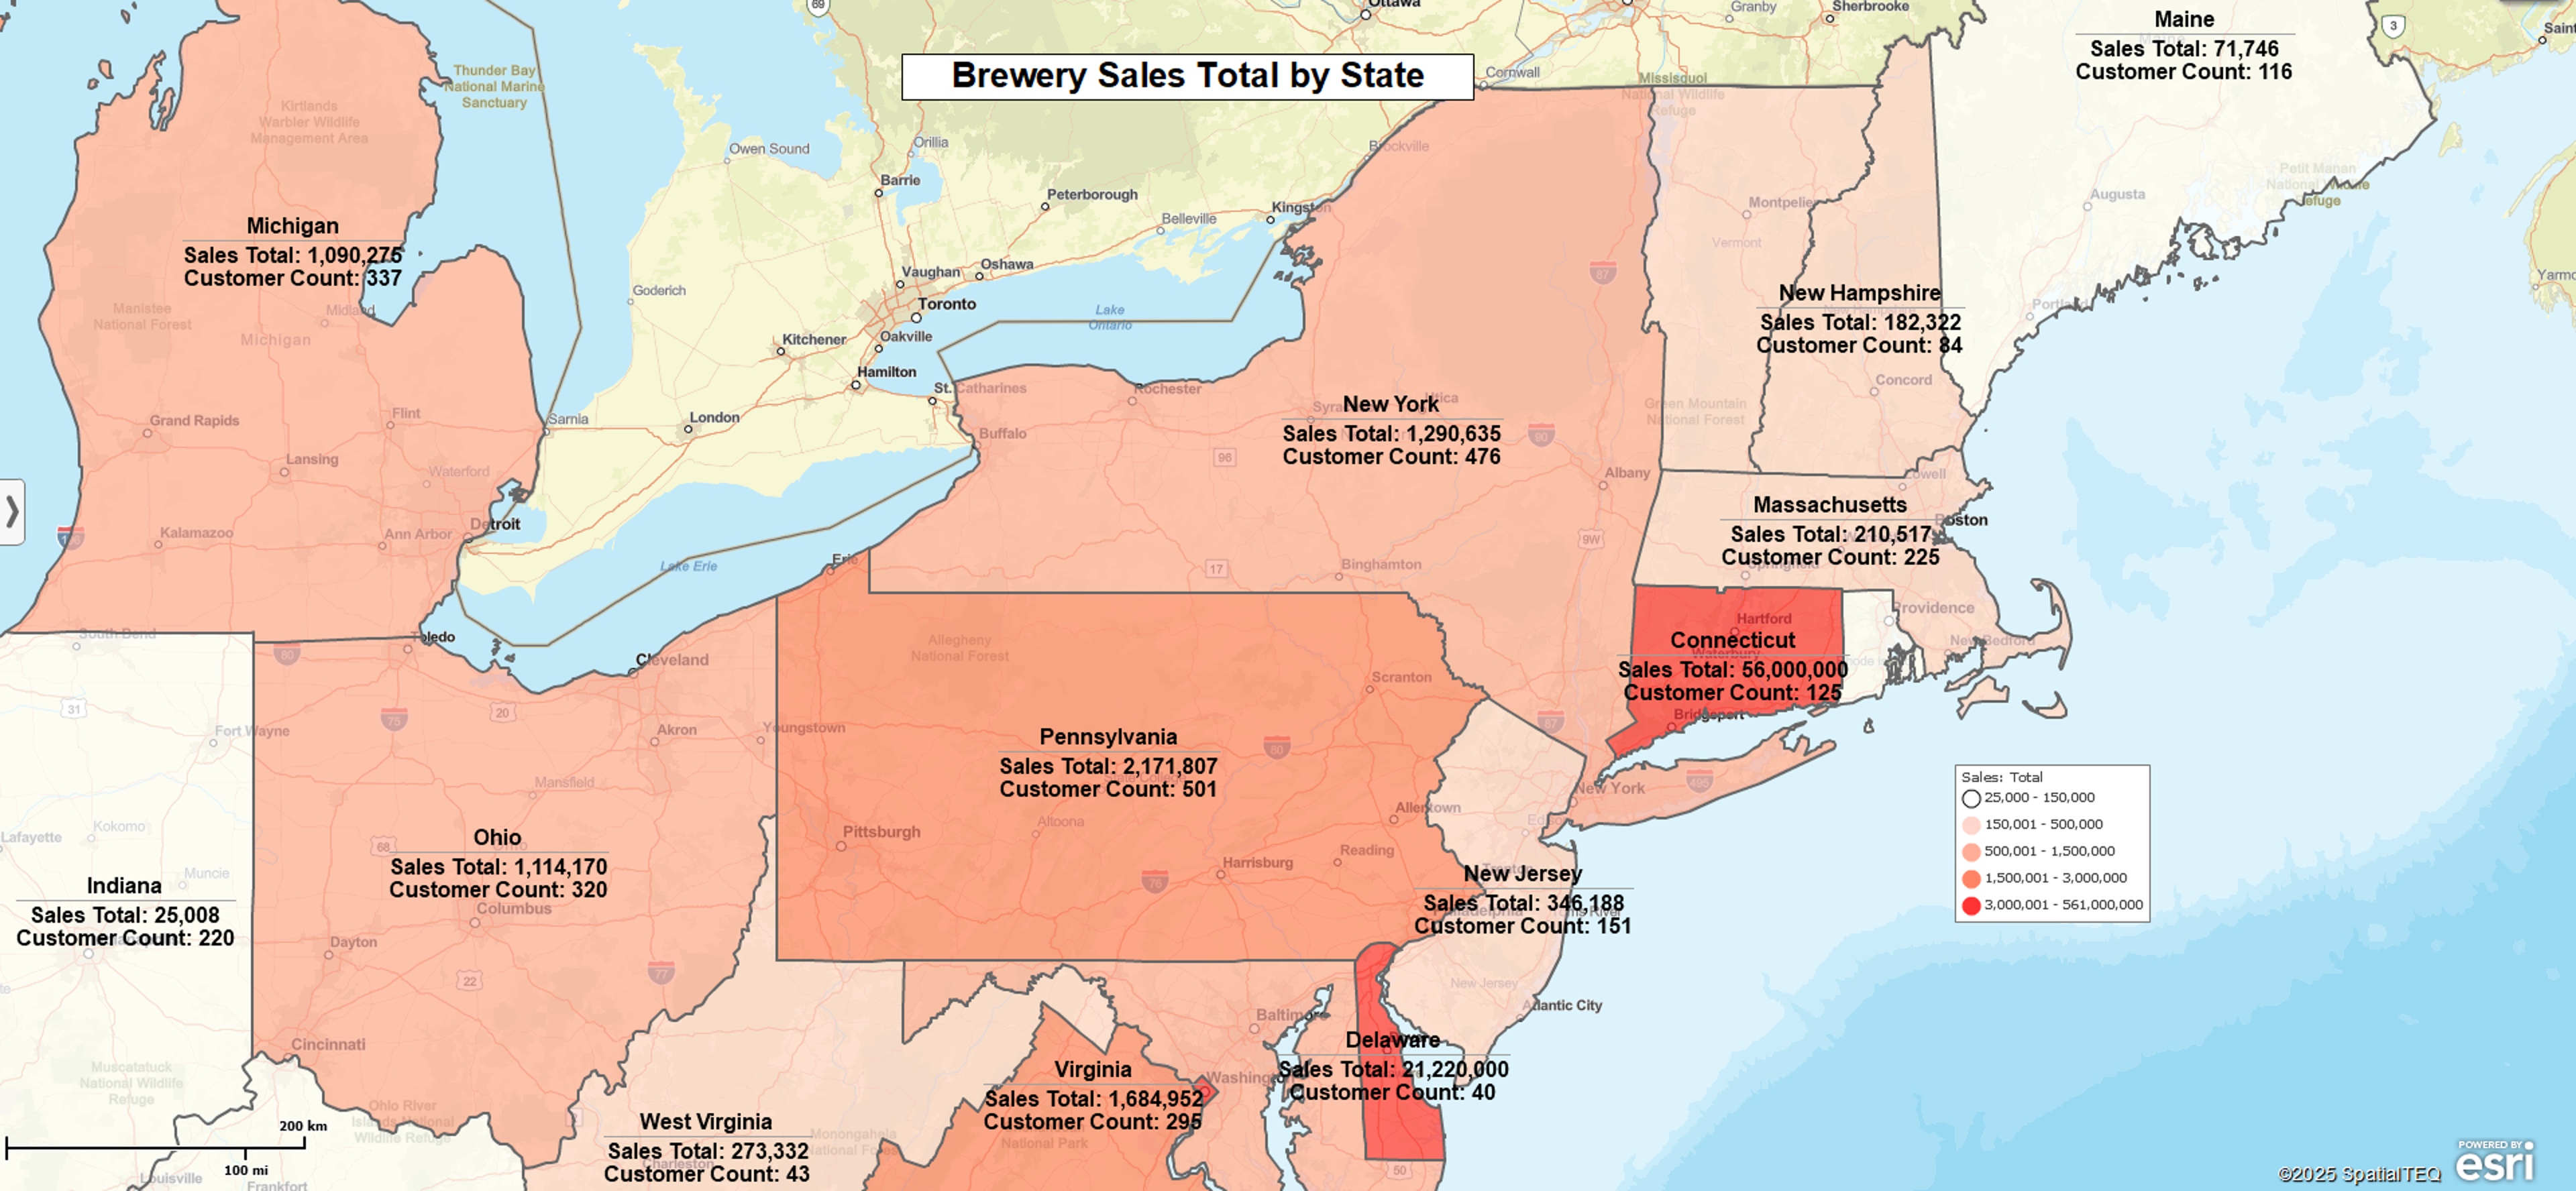
Load a spreadsheet of addresses that has a column with a numeric value (like sales volume) or a text value (like product name). MapBusinessOnline can use it to build various color-coded maps, symbol maps, heat maps. Add any information from your customer data to labels on a map. Aggregate sales data for a geographical area of interest like a radius, a polygon, or a ZIP code, county, or state.
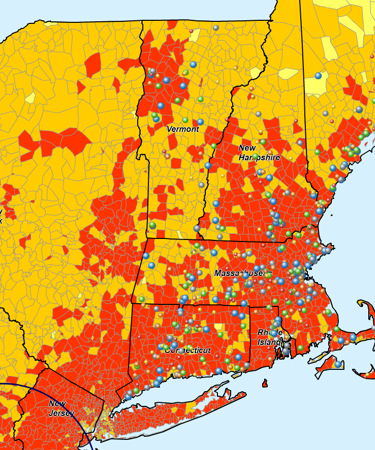
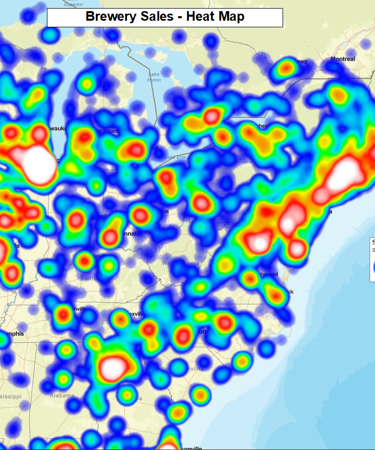
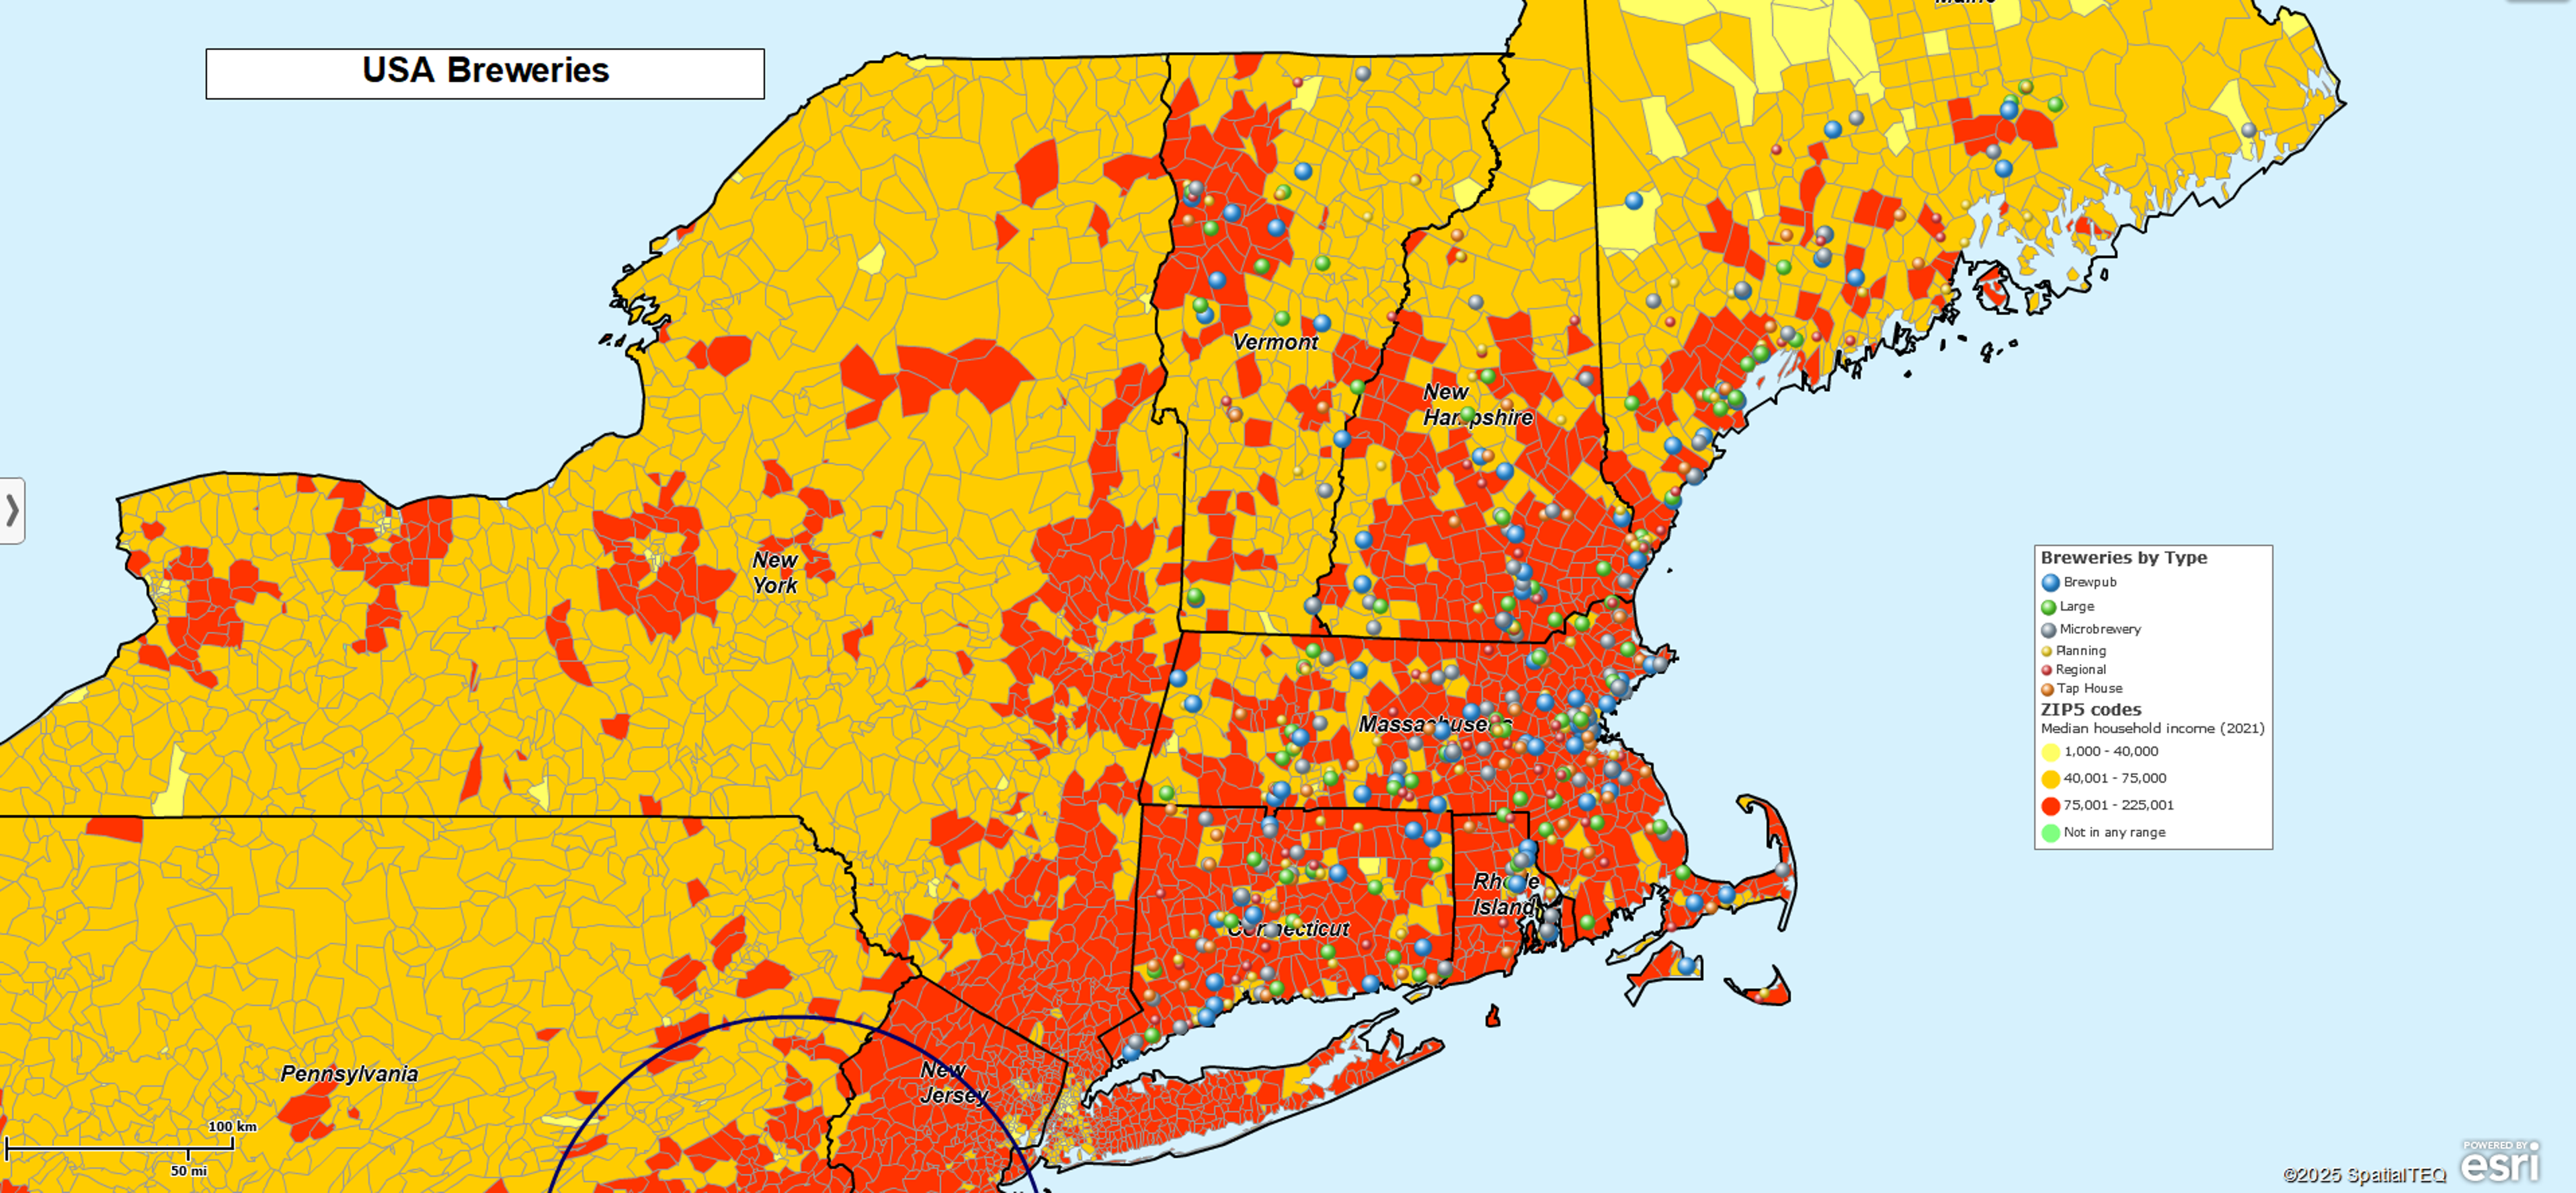
Get Visual Insights into Sales Performance
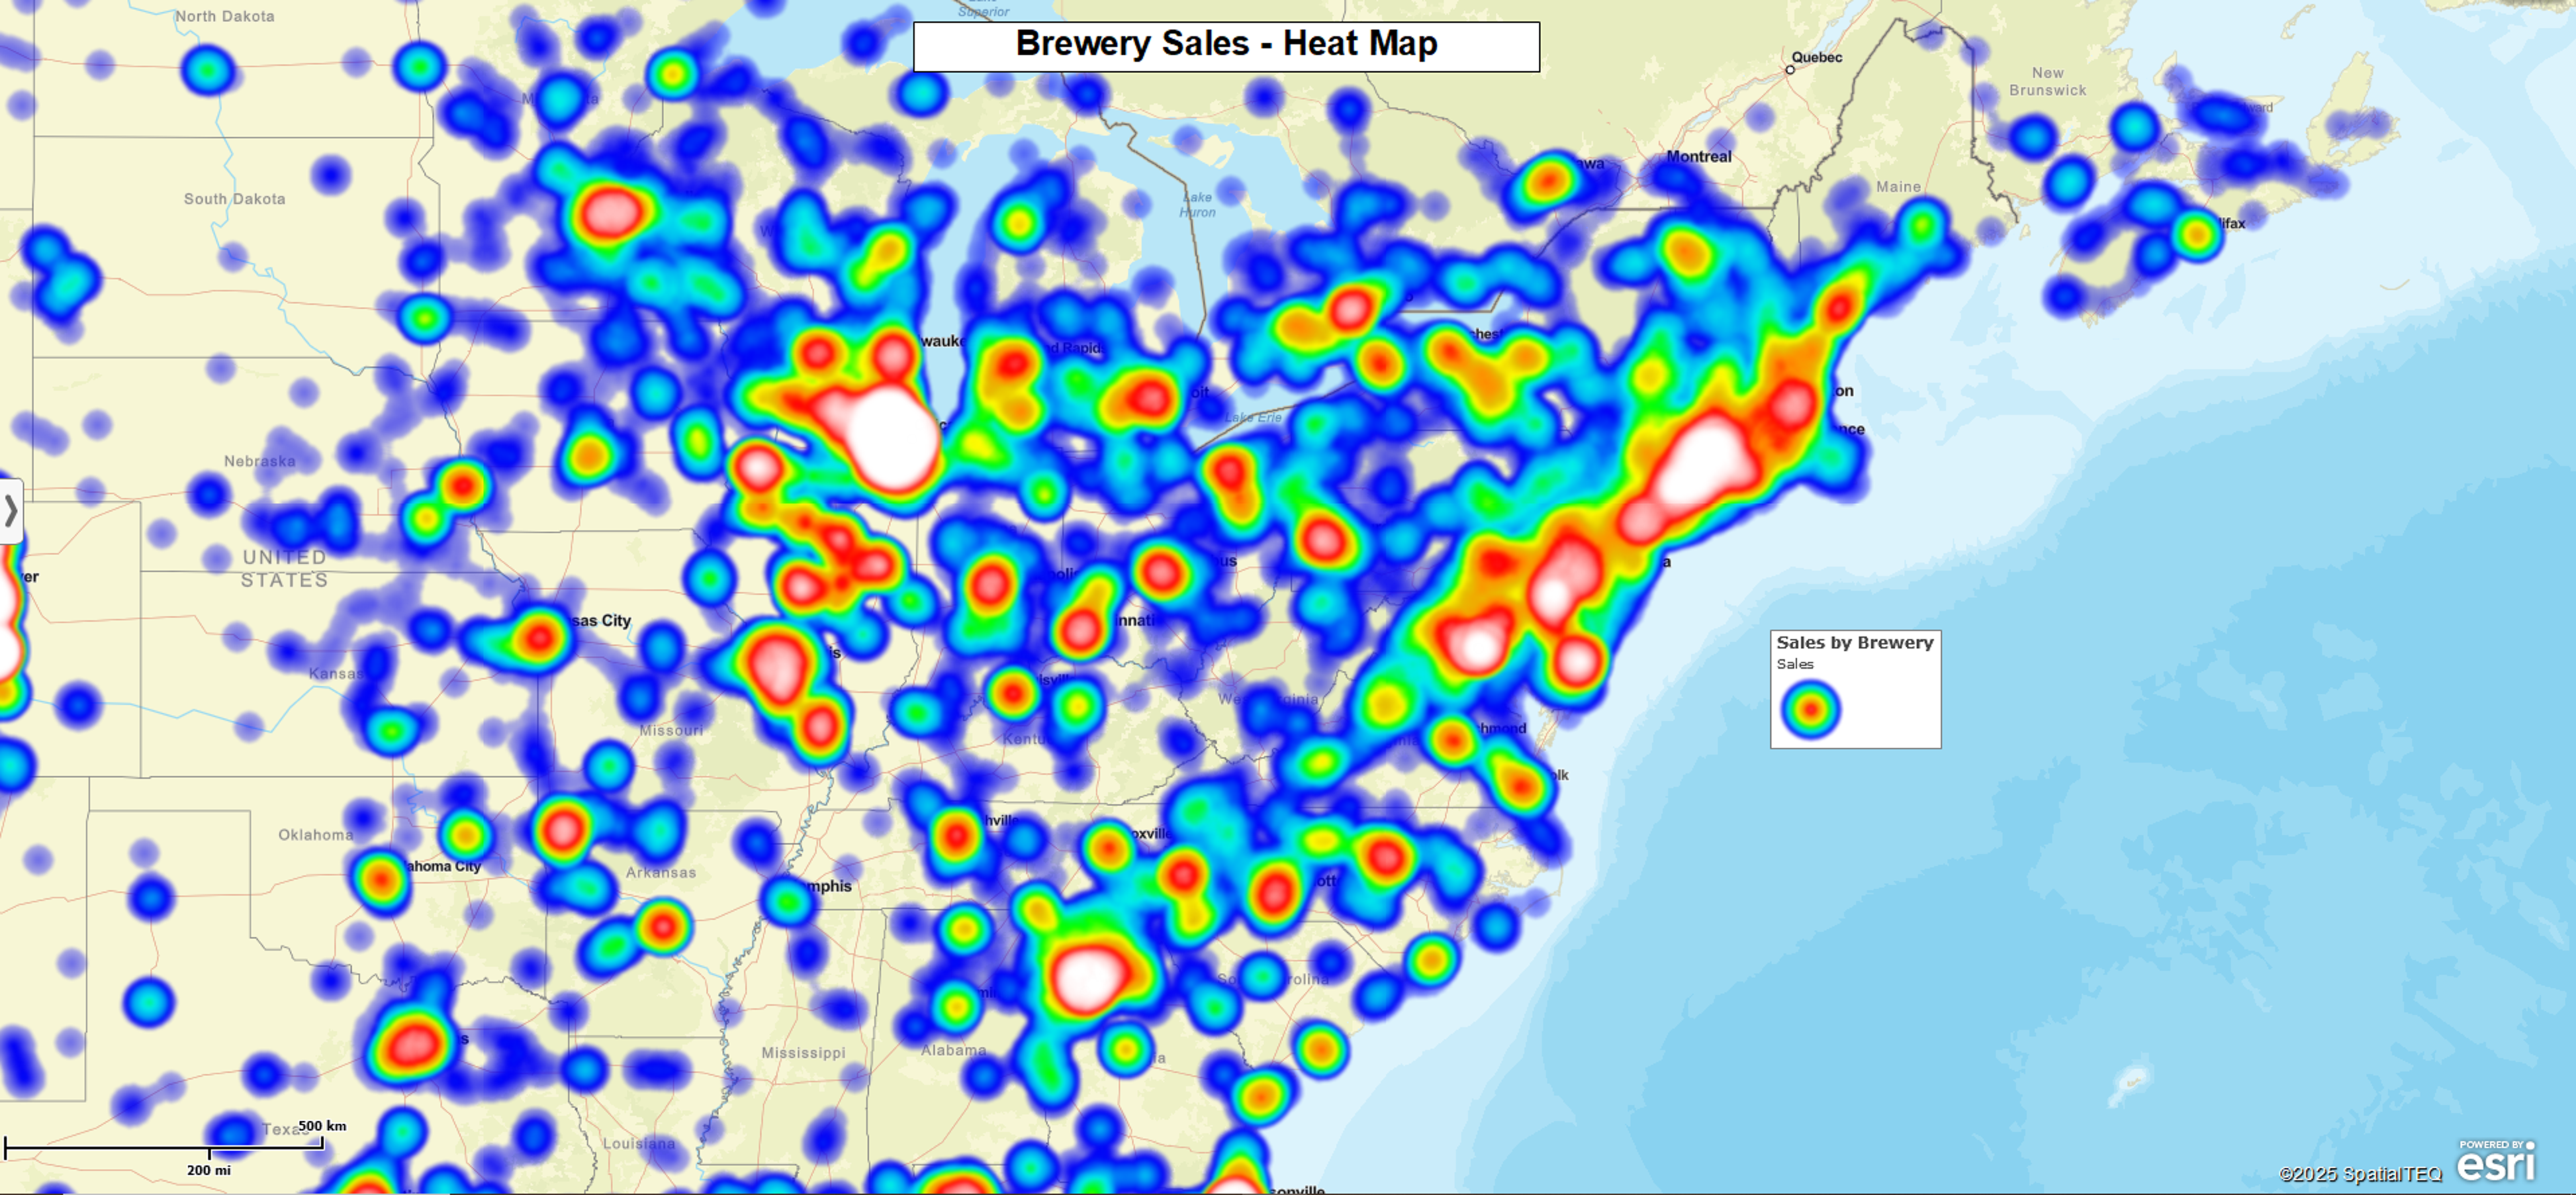
Color code your customers by sales volume for quick visual insights. Represent higher-performing sales reps with larger symbols on a map. Differentiate customer types using distinct symbols for each category. Let a heat map show you the areas with higher and lower customer density. Easily see opportunities for your sales growth.
Display Sales Trends with Charts
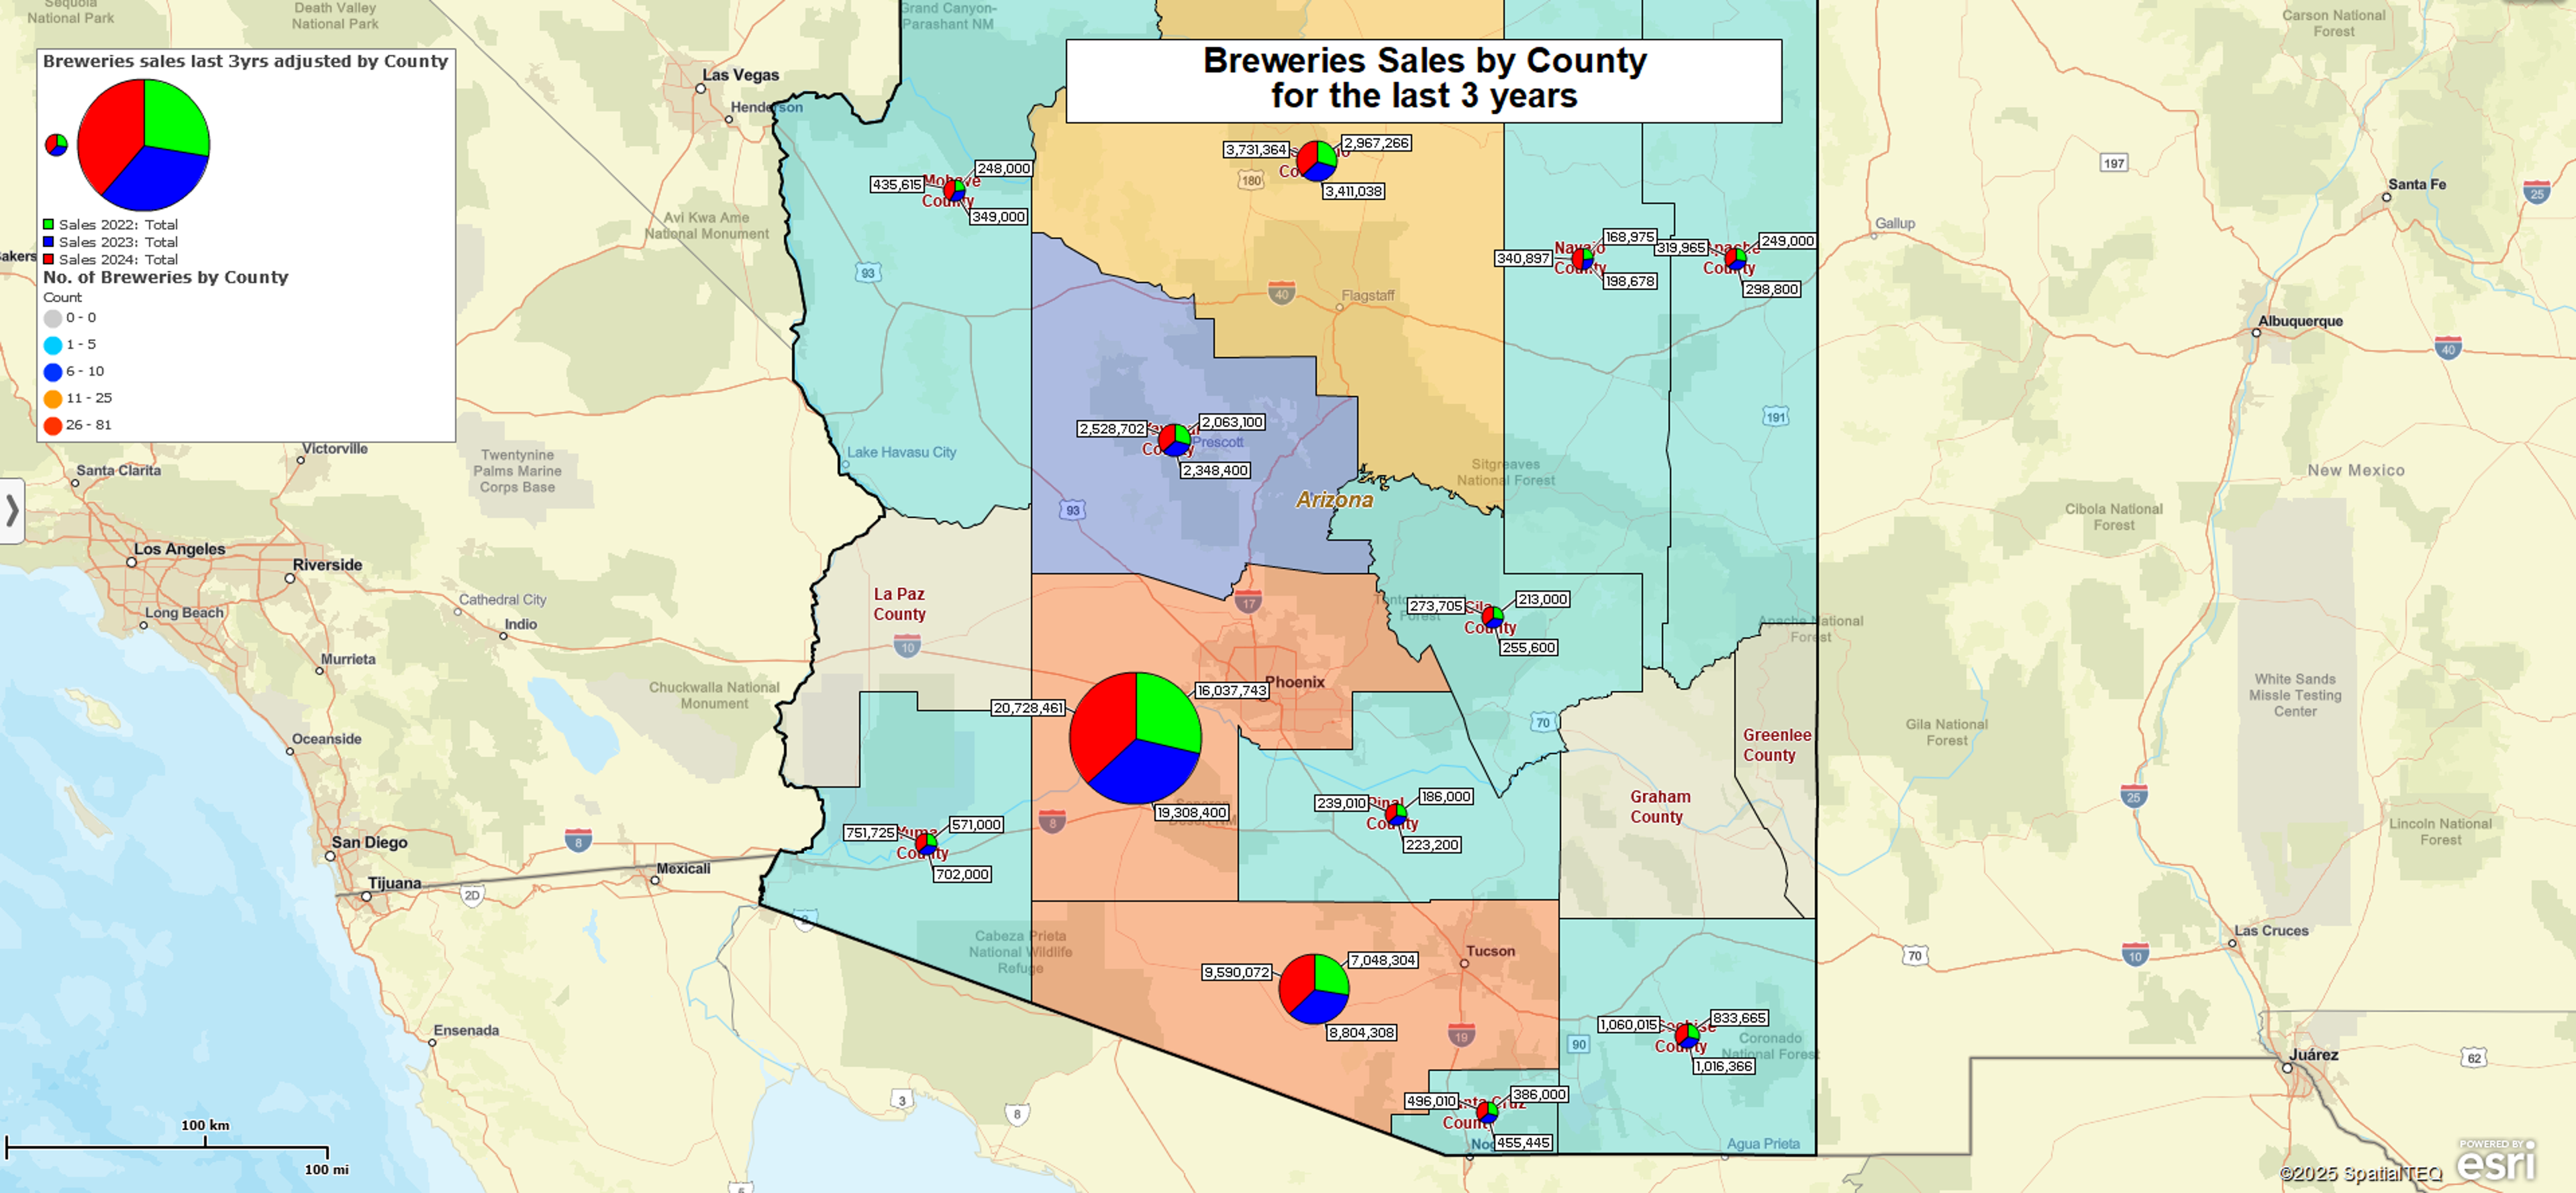
Color code your data with charts. Use bar charts to visualize sales trends over multiple years for every customer, sales rep, or shop on your map. Utilize pie charts to visualize the share of each of your multiple products.
Search Customer Data within an Area
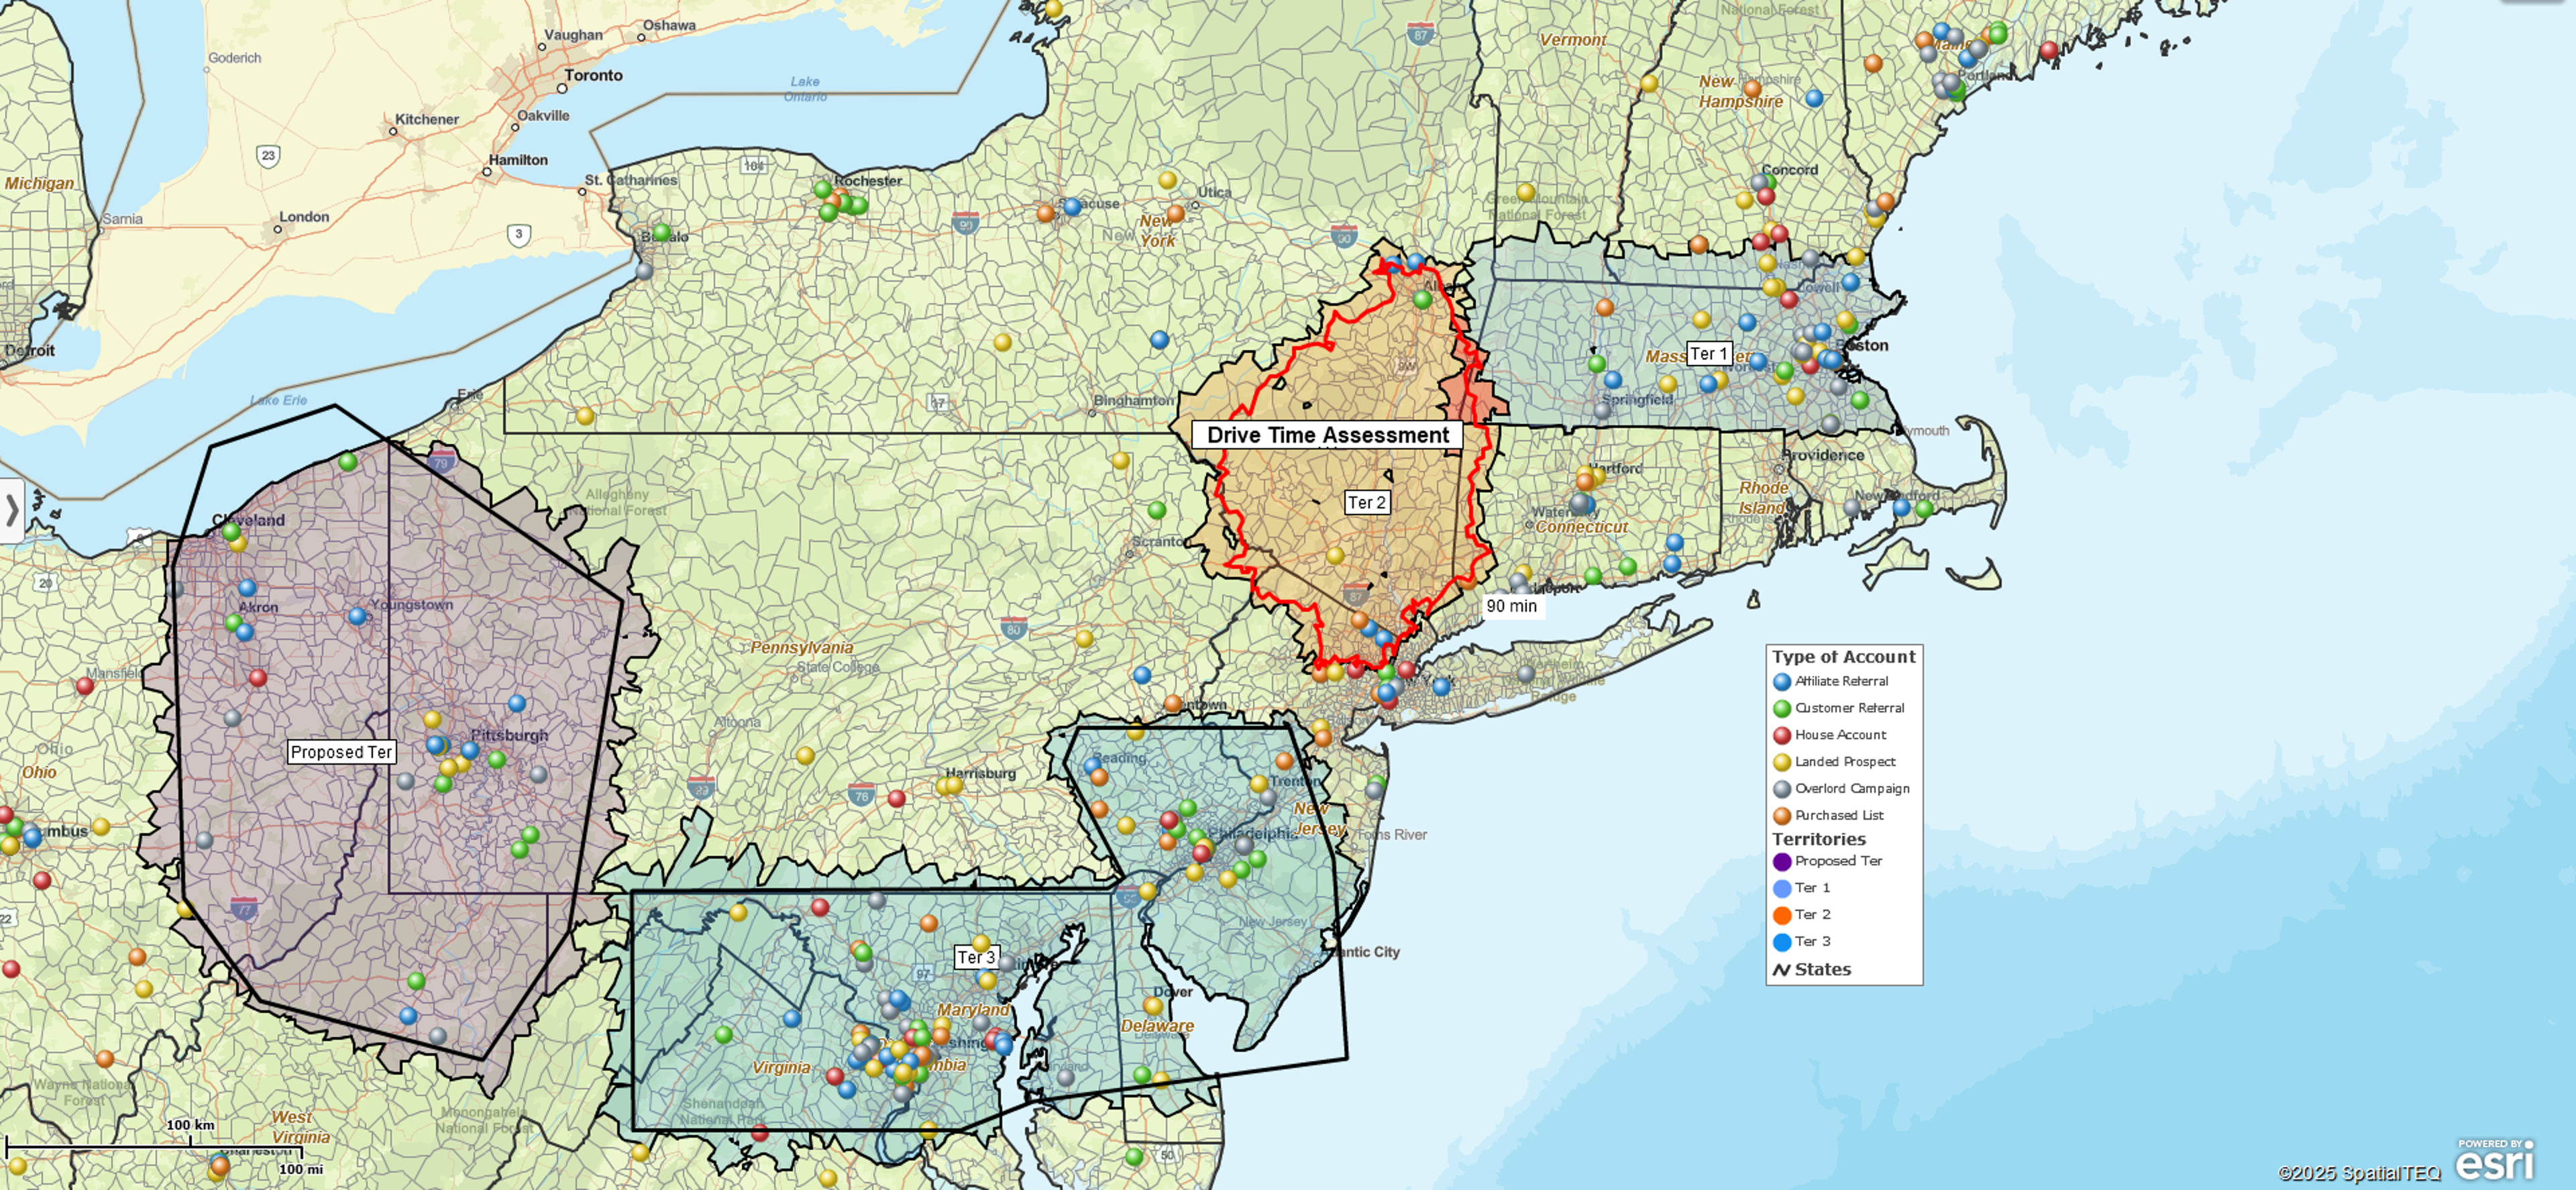
Query your customer list by radius, polygon, or drive time. A sales map is an excellent tool for slicing and dicing your customer base as you look for opportunities or, on the contrary, gaps in your current sales strategy or sales area.
Generate Leads Using Business Listings Data
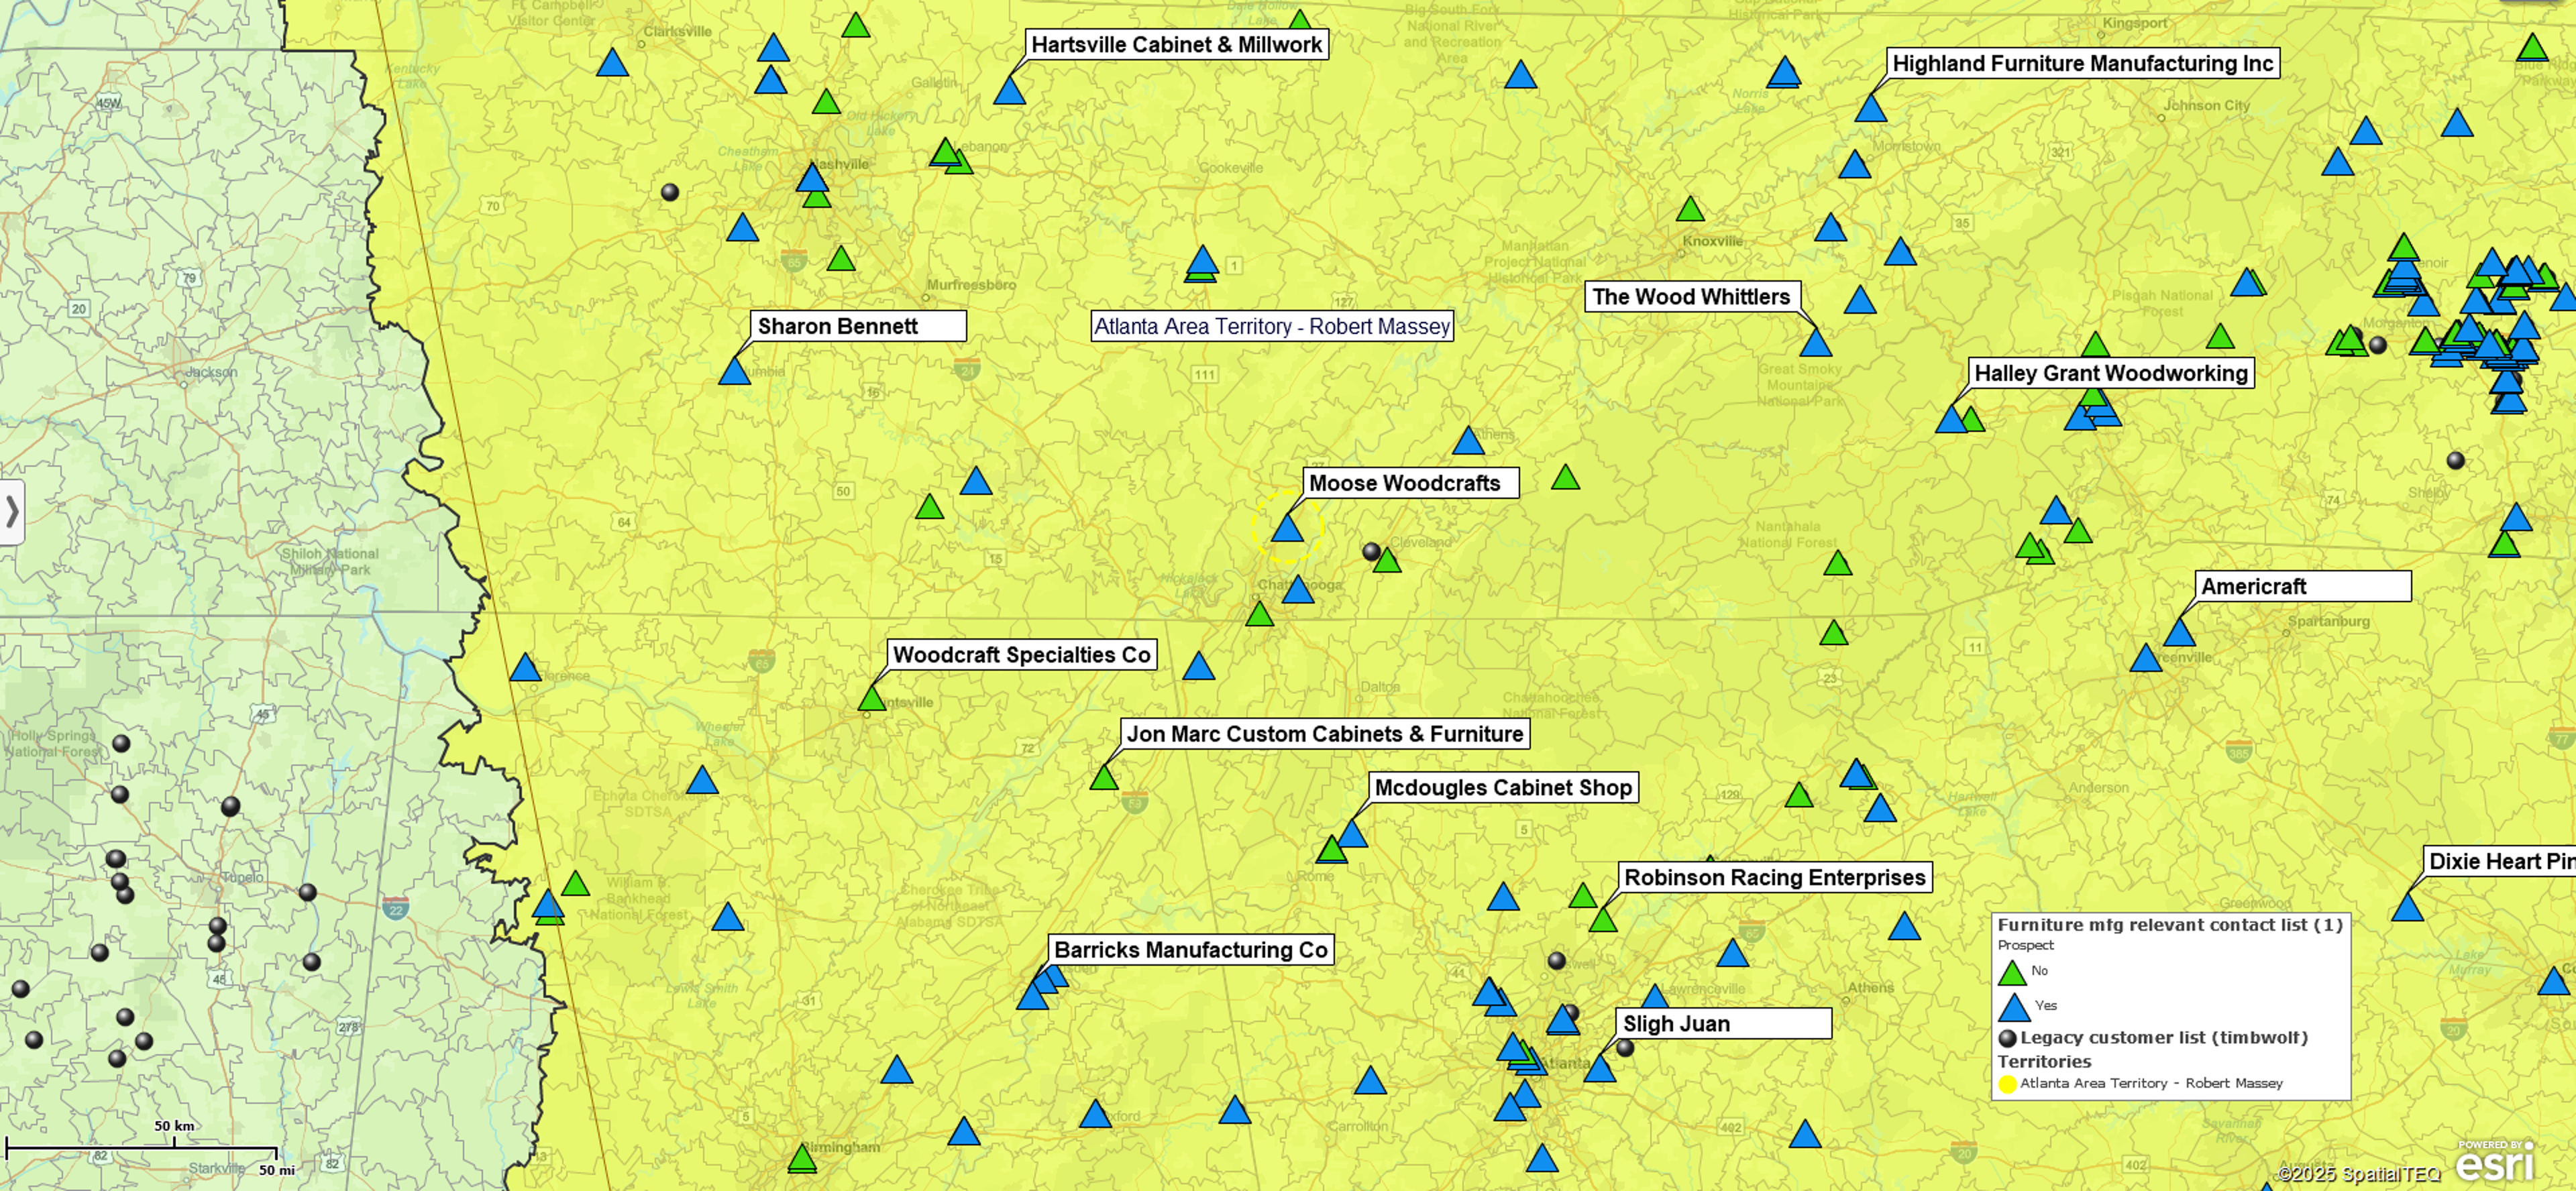
Search the business listings provided with MapBusinessOnline to find contacts and map locations of businesses that could become your potential customers. Use demographic data to identify an area of business interest and narrow down your search. Adjust your sales territories to align sales resources with the market potential.
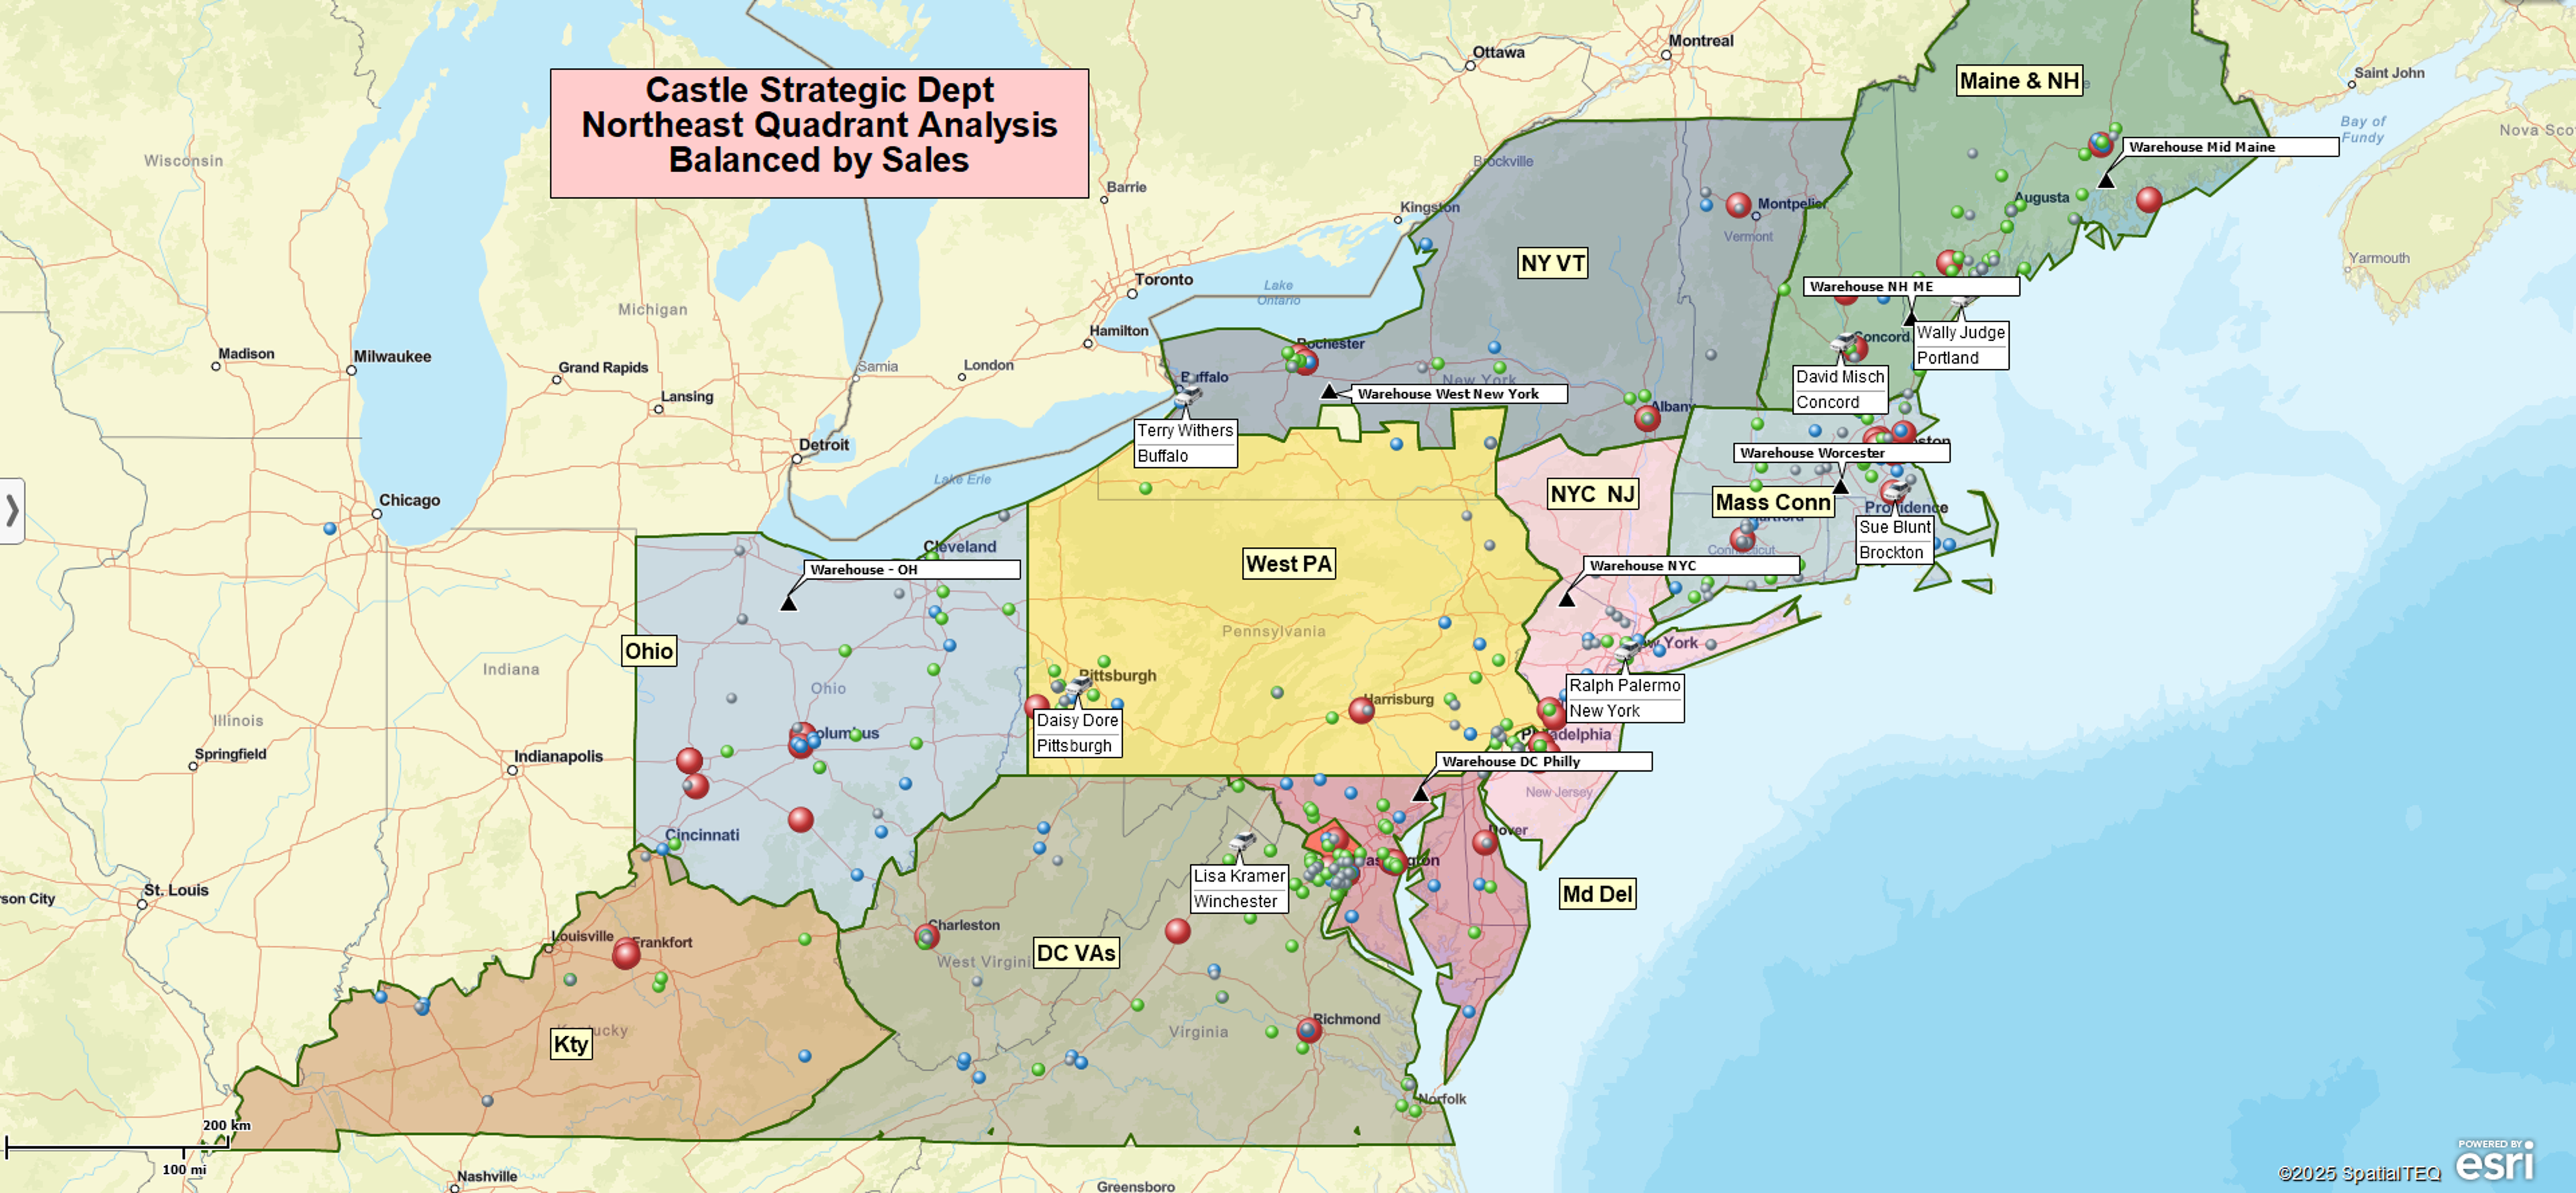
Design and Manage Sales Territories
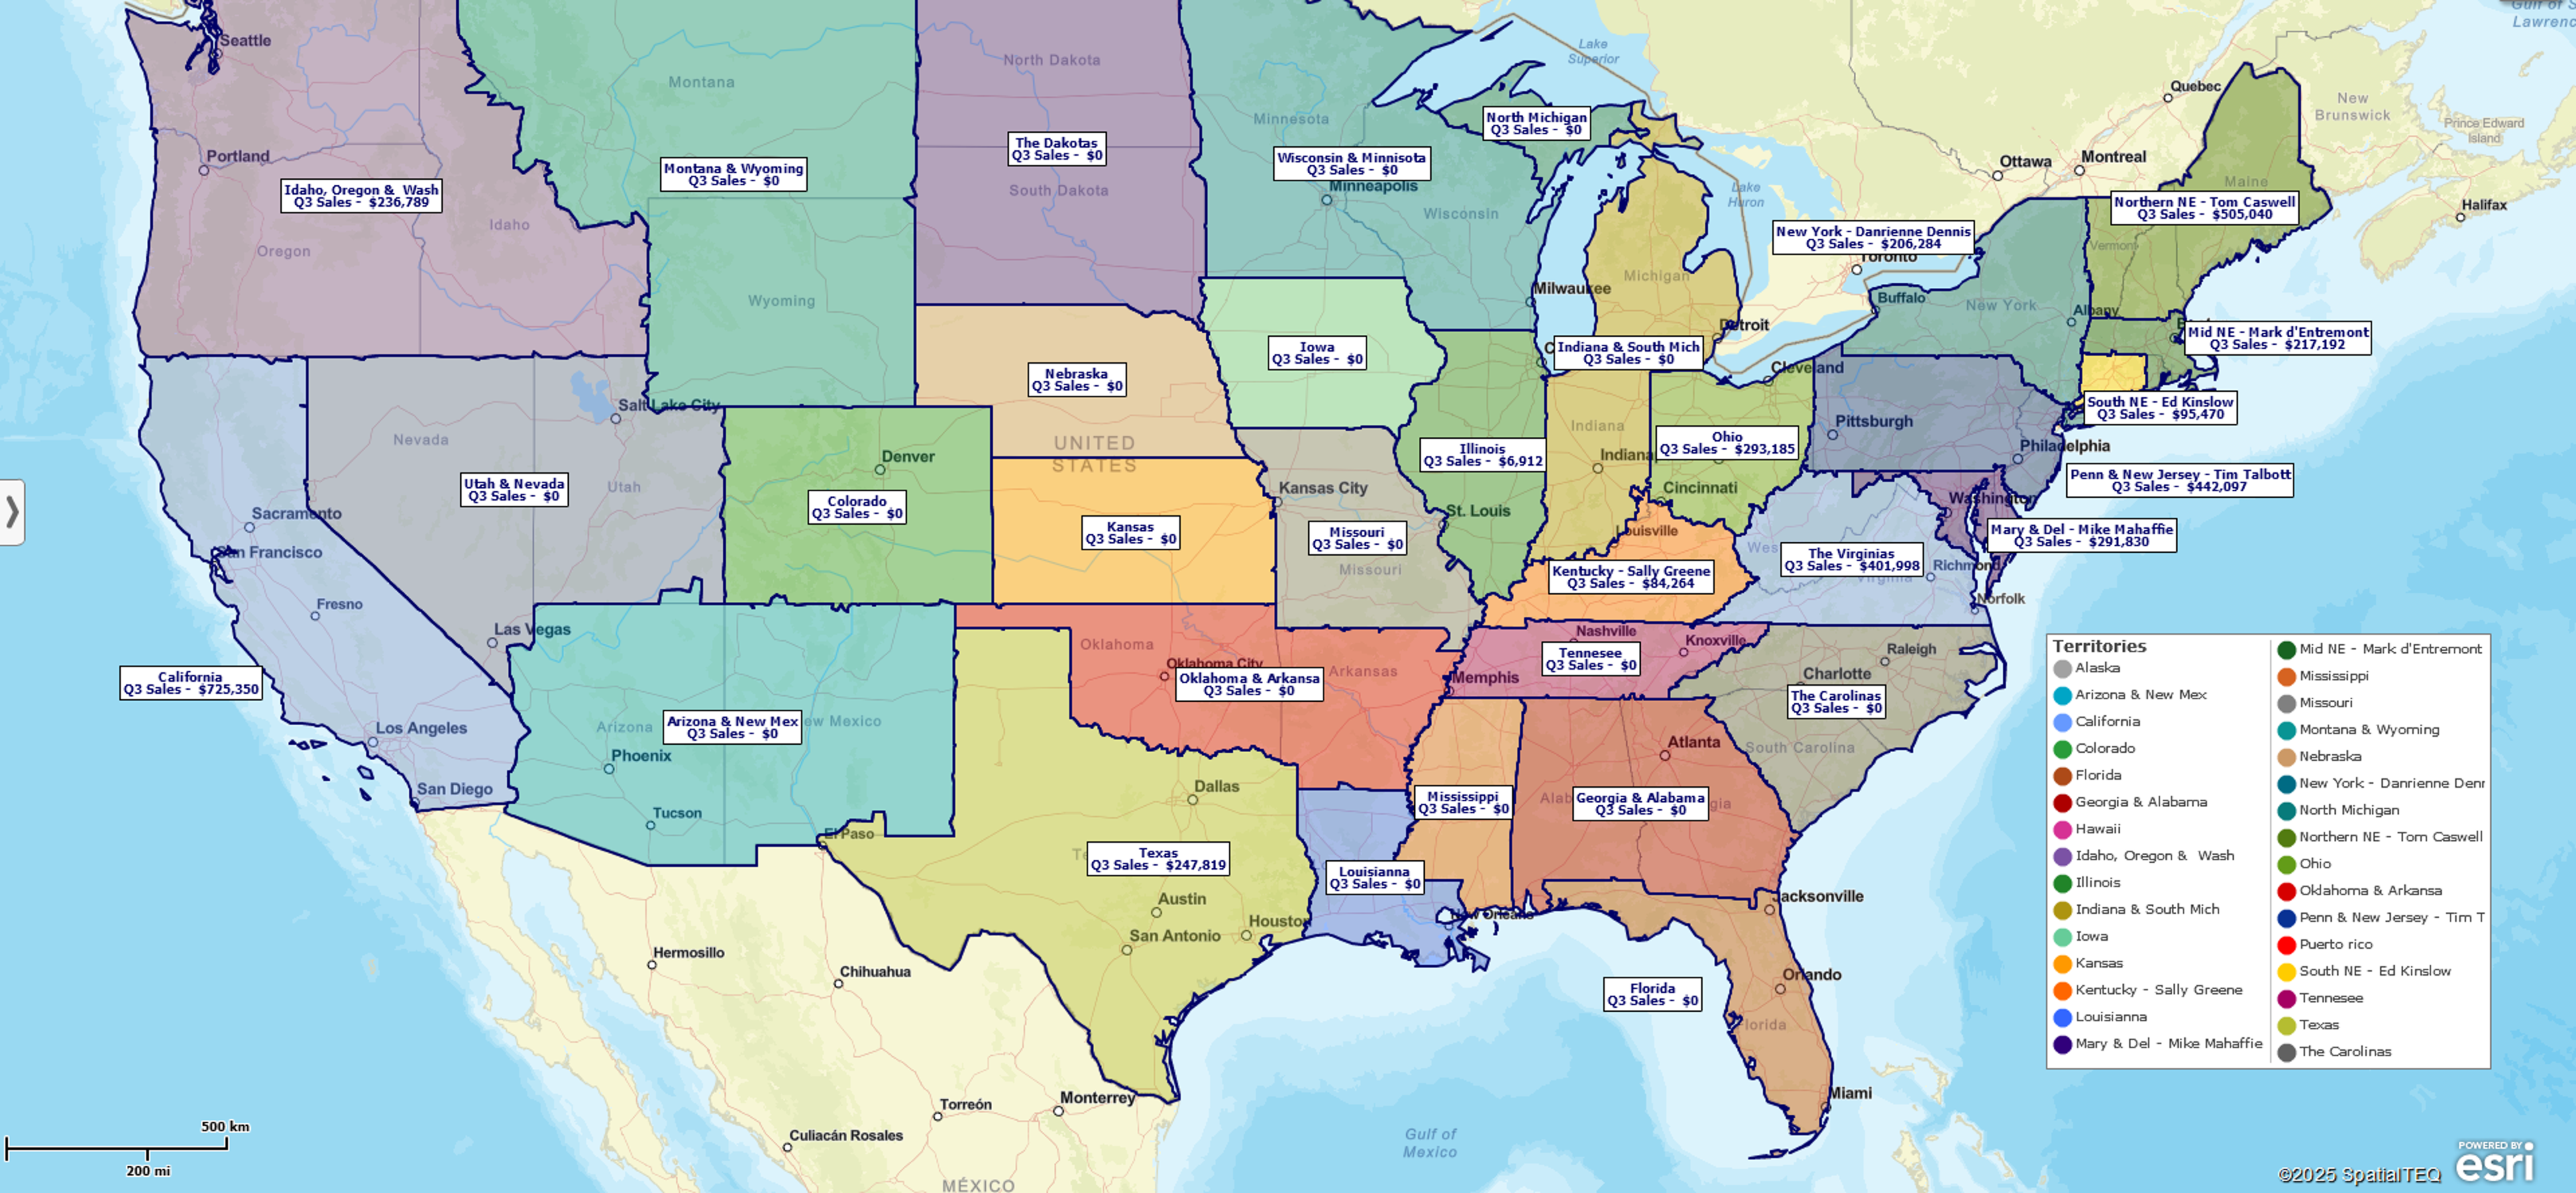
A step up in sales business efficiency is moving from sales mapping to sales territory mapping. Design sales territories that best use your sales team. Use demographic data to estimate the territory potential. MapBusinessOnline includes a comprehensive and easy-to-use territory management solution.
Plan Optimized Sales Routes
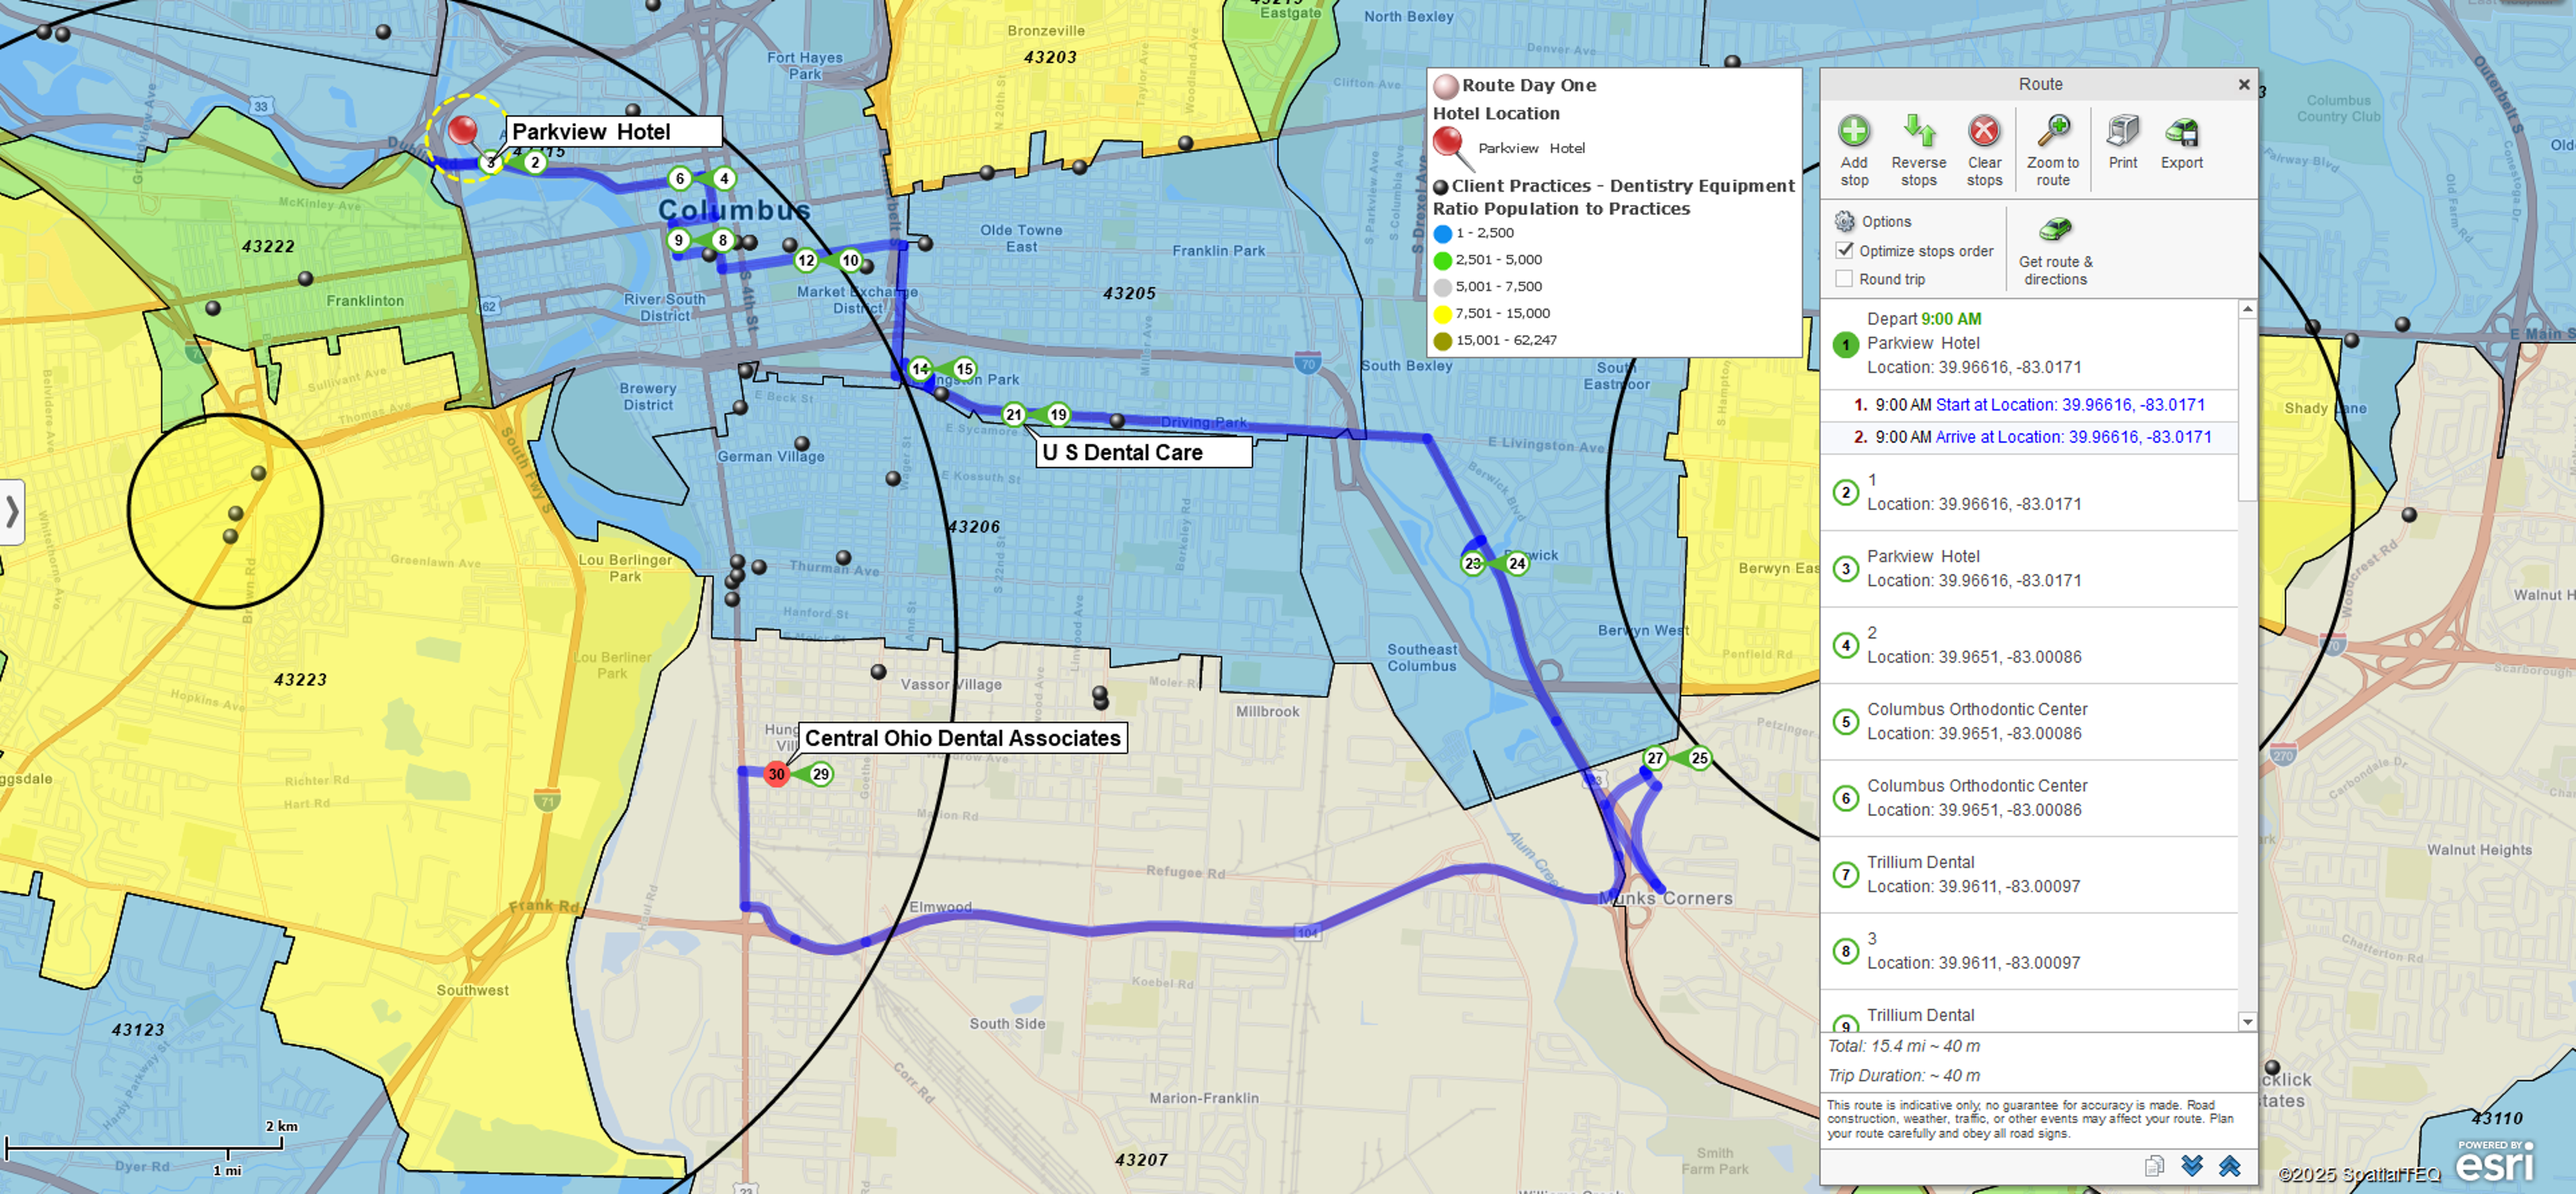
If you have your customers mapped, you can use MapBusinessOnline to plan optimized sales routes to visit the customers. Make sales calls more efficient and productive.
Share Sales Maps
Share interactive sales maps with non-subscribers. Collaborate on privately shared maps with your colleagues. Export and print high-resolution map images.


