
MapBusinessOnline sales territory mapping is easy to use. Our sales territory alignment tools are designed to be accessible by any businessperson. These tools are similar to Microsoft’s MapPoint mapping software, canceled at the end of 2014.
That said, online business mapping software has rules of the road that help build compelling, well-defined sales territories.
Alignment Map Layer
MapBusinessOnline sales territories are based on alignment map layers – ZIP codes, counties, states, and city limits. There are two ways a user creates territories:
- Lasso using a polygon draw tool
- Data import of a territory spreadsheet
The user can lasso an area with a polygon tool to gather ZIP codes or other map alignment layer objects. A user could also import a spreadsheet of districts like ZIP codes or counties. Either way, the user gets a territory based on a map layer. Read more about sales territory creation.
One territory rule is, territories are created based on one alignment layer at a time. The territory map creator cannot combine State and County or County and ZIP code layers within the same territory. Thus, if you want to change a State-based territory, to make the state area smaller or straddle state lines, you’ll need to reconstruct that territory out of counties or ZIP codes.
The above noted map layer constraint means, for example, a multi-state sales territory map is better served if the map layer applied is counties or ZIP codes rather than states because that provides more flexibility for area adjustments over time. Like life, most territory maps are not set in concrete. Things tend to change and territories should too.
While this can seem frustrating to a new user, territory creation is a quick process to master and takes just a minute or two to reassess a territory scheme.
A territory map can contain more than one type of map layer-based territory. You could have an overall territory map that includes both county-based and ZIP code-based territories. That is, you can have two territories based on different map alignment layers, but you can’t have two alignment layers in the same territory. Multi-alignment layer per allowance map can be helpful for businesses that cater to both urban and rural customer-bases like home care agencies or delivery services.
While the software does include draw tools, it does not provide a method for designating highways and terrain features as territory boundaries. This blog describes the challenges of non-alignment layer territory mapping.
MapBusinessOnline does provide additional territory map alignment layers you can add to your map from the Add Map Layers button. Additional layers that can be used for territory creation include Census tracts, MAS’s, school districts, and congressional districts. Try building territories on the City Limits layer or the Census Tract layer.
Edit Your Territories
MapBusinessOnline includes a list of territory editing tools that make it easy to adjust your territories after you’ve created them:
- Edit a territory map by selecting a ZIP code, county, or other map alignment layer target with your mouse cursor. Hold down the shift key to select more than one. Once selected, click the Blue Puzzle Piece icon and choose the required action – remove, update, add to, etc.
- Select the Territory Name and click the associate toolbar’s Properties Gear to adjust territory color, territory name, or to format territory labels
- Label formatting allows the map editor to add demographic data or imported data, like sales numbers, to the territory flex fields. All demographic segments can be summed into these territory and map layer label fields. For example, a territory made up of five ZIP codes will display the sum of the population for those five ZIP codes in a territory label flex field. You have five flex fields you can add data to. This is a powerful way to display relevant territory data
Here’s a video on editing territories.
Your Map’s Look and Feel
The Map and Data box holds the key to map look and feel when it comes to territories. Hover your mouse cursor over the Territory layer in Map and Data. Here you’ll find controls over border color and thickness and fill color. Adjustments to label font sizes and color can be made through the Map and Data box. This is where you can make your map appear more professional, or, if you prefer, more whacky and cluttered.
Remember your territory map is just one aspect of your business. Don’t try to solve too many problems with just one map. Read more about making a business map look professional.
Analyze Your Territories
As each sales territory is created, the process opens the Data Window territory view. This analysis view allows the user to open a simple database management tool by clicking the Choose Columns button in the lower right of the panel. I have written a recent blog about the analysis capabilities of MapBusinessOnline sale territory mapping. It’s an easy database tool to master that provides a wealth of information about your territories.
Territory analysis views allow the map creator and the map viewer to consider their territory’s metrics. Every company bases its territory measurements on their particular industry metrics. Restaurants like to see the quantities of population and household segments. Retailers like household income data. Homecare agencies and franchises adore the 65-and-up age segments. Large manufacturing concerns may be focused on more industry-specific metrics, some of which you can derive from MapBusinessOnline business listings.
MapBusinessOnline provides access to multiple data layers that may be relevant to your territory analysis. All location-data layers (once imported) can be accessed from the Data Window territory analysis view. They include:
- Demographic Data – USA Census demographic data, USA projection data (most recent two years in the list of Demographic Data), and Canadian demographic data
- Business Listings – NAICS/SIC industry code business listings. These are paid for data downloads using the Yellow Pages Icon button on the master toolbar
- Imported business data – Typically sales data, this data could be any numeric business datasets available for your analysis
Regardless of the relevant location-data driving your product sales, import this information into your MapBusinessOnline territory analysis view and give the data some thought. Look for trends. Compare an area you are familiar with new areas of interest around the country. Do some analysis. You’ll be a better, smarter human being if you do.
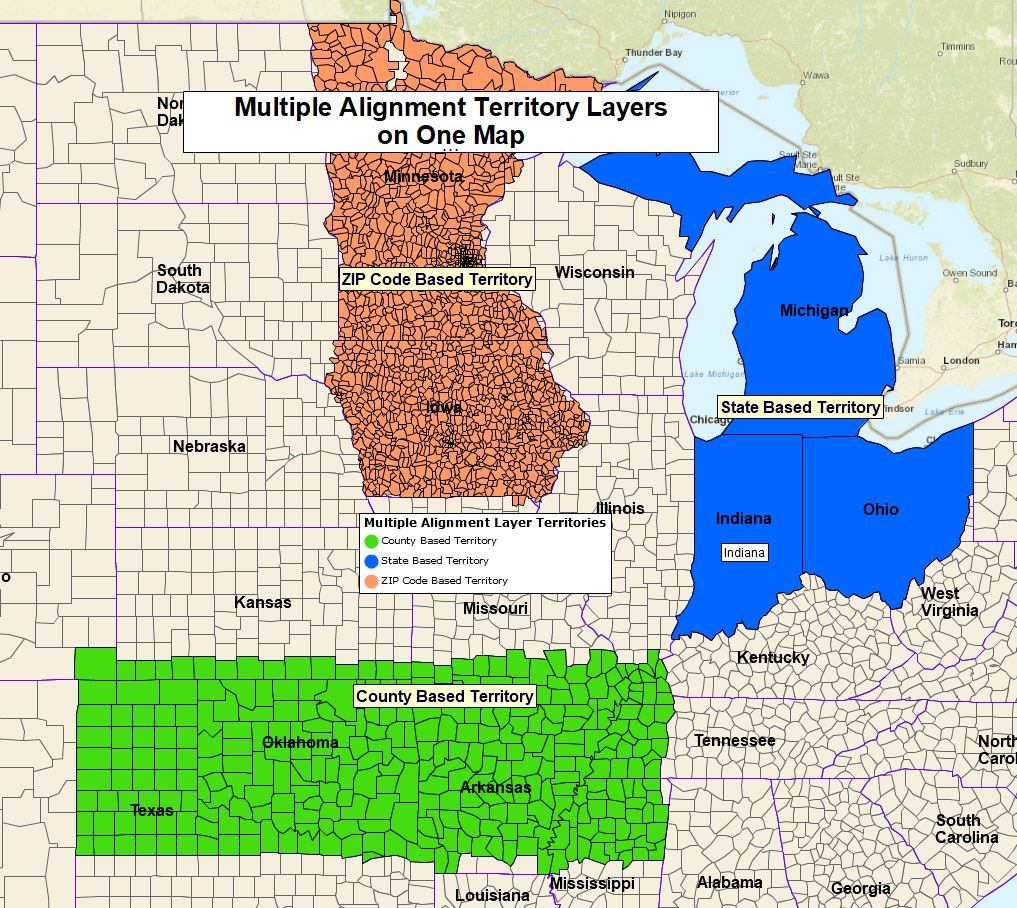
Multiple Alignment Layers Across One Territory Map
Other Pertinent Territory Issues
Upper Limit – The maximum number of territories one can build with a MapBusinessOnline subscription is 1,000. Let us know if you reach this cap.
Color-Code Your Territories – Territory maps can be color-coded based on thematic data, just like any other MapBusinessOnline map layer. These tools are available in Map and Data or by clicking the Three Puzzle Piece icon button on the master toolbar.
Territory Overlap – MapBusinessOnline addresses overlap in the Map and Data territory settings. Territory map creators can assign specific colors to areas of overlap. Map creators typically apply bright or dark colors that standout and alert the map viewer that overlap exists in the territory scheme under review.
Exporting All ZIP Codes from a Territory – ZIP codes come in two flavors – Boundary ZIP codes and Point ZIP Codes. To export all possible ZIP codes across a territory or all of your territories, you need to import the Total ZIP Code layer available through MapBusinessOnline Public Data. Read more here.
Several other recent blogs may be helpful as you learn more about sales territory mapping:
- Advanced territory mapping capabilities
- Sales territory analysis in MapBusinessOnline
- Why business users choose MapBusinessOnline territory mapping
- Common questions regarding territory mapping
_______________________________________________________
Replace Microsoft MapPoint with MapBusinessOnline Standard. The industry’s best MapPoint Replacement. Try MapBusinessOnline – business mapping software for PC or Mac.
_______________________________________________
MapBusinessOnline access has officially transitioned from Web Browser (Adobe Flash Player) access to the Map App download access.
- Please download the Map App from the website – https://www.mapbusinessonline.com/App-Download.aspx.
- After installing the Map App, the MapBusinessOnline launch button will be in the Windows’ Start Menu or Mac Application folder. Find the MapBusinessOnline folder in the Start Menu scrollbar. Click the folder’s dropdown arrow and choose the MapBusinessOnline option. You can drag the Icon to the task bar for a quick launch button.
- All saved maps will be available through your Map Library Folder, the second button in from the left on the Master Toolbar. (Green File Folder icon.)
Map App access to MapBusinessOnline.com provides enhanced features and a better user experience.
The Map App includes the new Map Viewer app for free non-subscriber map sharing.
Value-Added Resellers – Offer the tool to your customers as a reseller. Make money on training and consulting. Contact us with further interest in reselling MapBusinessOnline.
Find out why over 25,000 business users log into www.MapBusinessOnline.com for their business mapping software and advanced sales territory mapping solution. The best replacement for Microsoft MapPoint happens to be the most affordable.
Contact: Geoffrey Ives geoffives@spatialteq.com or Jason Henderson jhenderson@spatialteq.com