
Let’s build a demographic map of the USA. This process is fast and easy and should help you understand how to create your own demographic maps using business mapping software.
The first step, Click the New Map button and select the USA map template.
I’m going to walk through a variety of Demographic subjects with a basic map set-up. By set-up, I mean the visual layers turned on to make the map quickly understood and easy on the eyes. Those set-up options are:
- We’ll stick with a contiguous USA-wide view by County map layer. The County layer is checked on in Map and Data
- We’ll have the State layer checked on with labels and fill turned off. I have darkened the state boundary. Read more about editing map look and feel
- I’m completely turning off the background map data so the user can focus on demographic analysis. Remember that – you don’t always require a background map
MapBusinessOnline Demographic Subjects
MapBusinessOnline sources demographic data from the US Census Bureau’s American Community Survey program (ACS). The Census Bureau begins releasing the data from a decennial count six months to two years after the count takes place. Updates are released a few times a year after that until the next official decennial count takes place.
MapBusinessOnline incorporates those Census Bureau ACS releases into our software offering as soon as possible, depending on our planned development cycle. If you’ve paid attention to the Census news over the past two years, you can see how politics gets in the way of on-time Census data updates.
Customers sometimes inquire about differences between MapBusinessOnline Census data results and other third-party demographic sources they’ve used. Census data comparisons are often inaccurate. It can be difficult to achieve accurate apples-to-apples comparisons. Here are some critical criteria to consider:
- What is the data source? MapBusinessOnline uses the American Community Survey’s most recent release. That is not the only source available.
- What year and release data are you comparing? The MapBusinessOnline Census data is listed by year. The two most recent years are projections. The third most recent year (currently 2018) is the most recent ACS release
- What area on the map are you querying? Different mapping applications may vary in how they compile Census data by spatial query. For instance, ZIP5-Codes may not precisely match Census ZTCA ZIP code areas
- Your assumption on data trends from year-to-year or around category population shifts may be inaccurate. Local issues we’re not aware of impact demographic estimates. So an unexplained uptick in one city’s population may be explainable
Remember, Census releases and demographic services are always providing an estimate of demographic reality. Do not expect exactitude when it comes to demographic data analysis. It’s not like Census people can get everybody’s attention and scream, “People! People! Will everyone please sit down so we can count you?”
Demographic Data Categories in MapBusinessOnline
Now let’s create a demographic map.
With a full USA map, select the Color-coding by Boundaries button on the Master Toolbar. Select the Counties map layer and click next. For this blog, we’re sticking with Counties. You have many map layer choices – ZIP codes, City Limits, and more.
At the Setup Color Coding dialogue page, in the top dropdown select Demographic Data. In the following dropdown scroll down to the 2018 Census release section, find and select Employment Status (2018): Unemployed.
Leave the number of color groups, or ranges, displayed in the dialogue at 5. You could color-code and symbolize up to 100 groups. Who wants that?
- Let the MapBusinessOnline Numeric Range default control the color group’s numeric values.
- Beneath the color box section, select the Green Color Scheme by dropping down to that option
- In the top group, the lowest numeric range, click into the color-box and make the color a pale yellow, and set the lowest quantity numeric value to 1 instead of 0
- The other boxes should all be a shade of gradually darkening green. If they are not, simply Dropdown on the color scheme options and select graduated green as your choice, and then reset that lowest color range to pale yellow
- In the final step, select a gray color for the Not in any Group color group – make sure to check Fill. Now click Done
In this first slide, I’ve circled in Red the key elements listed above.
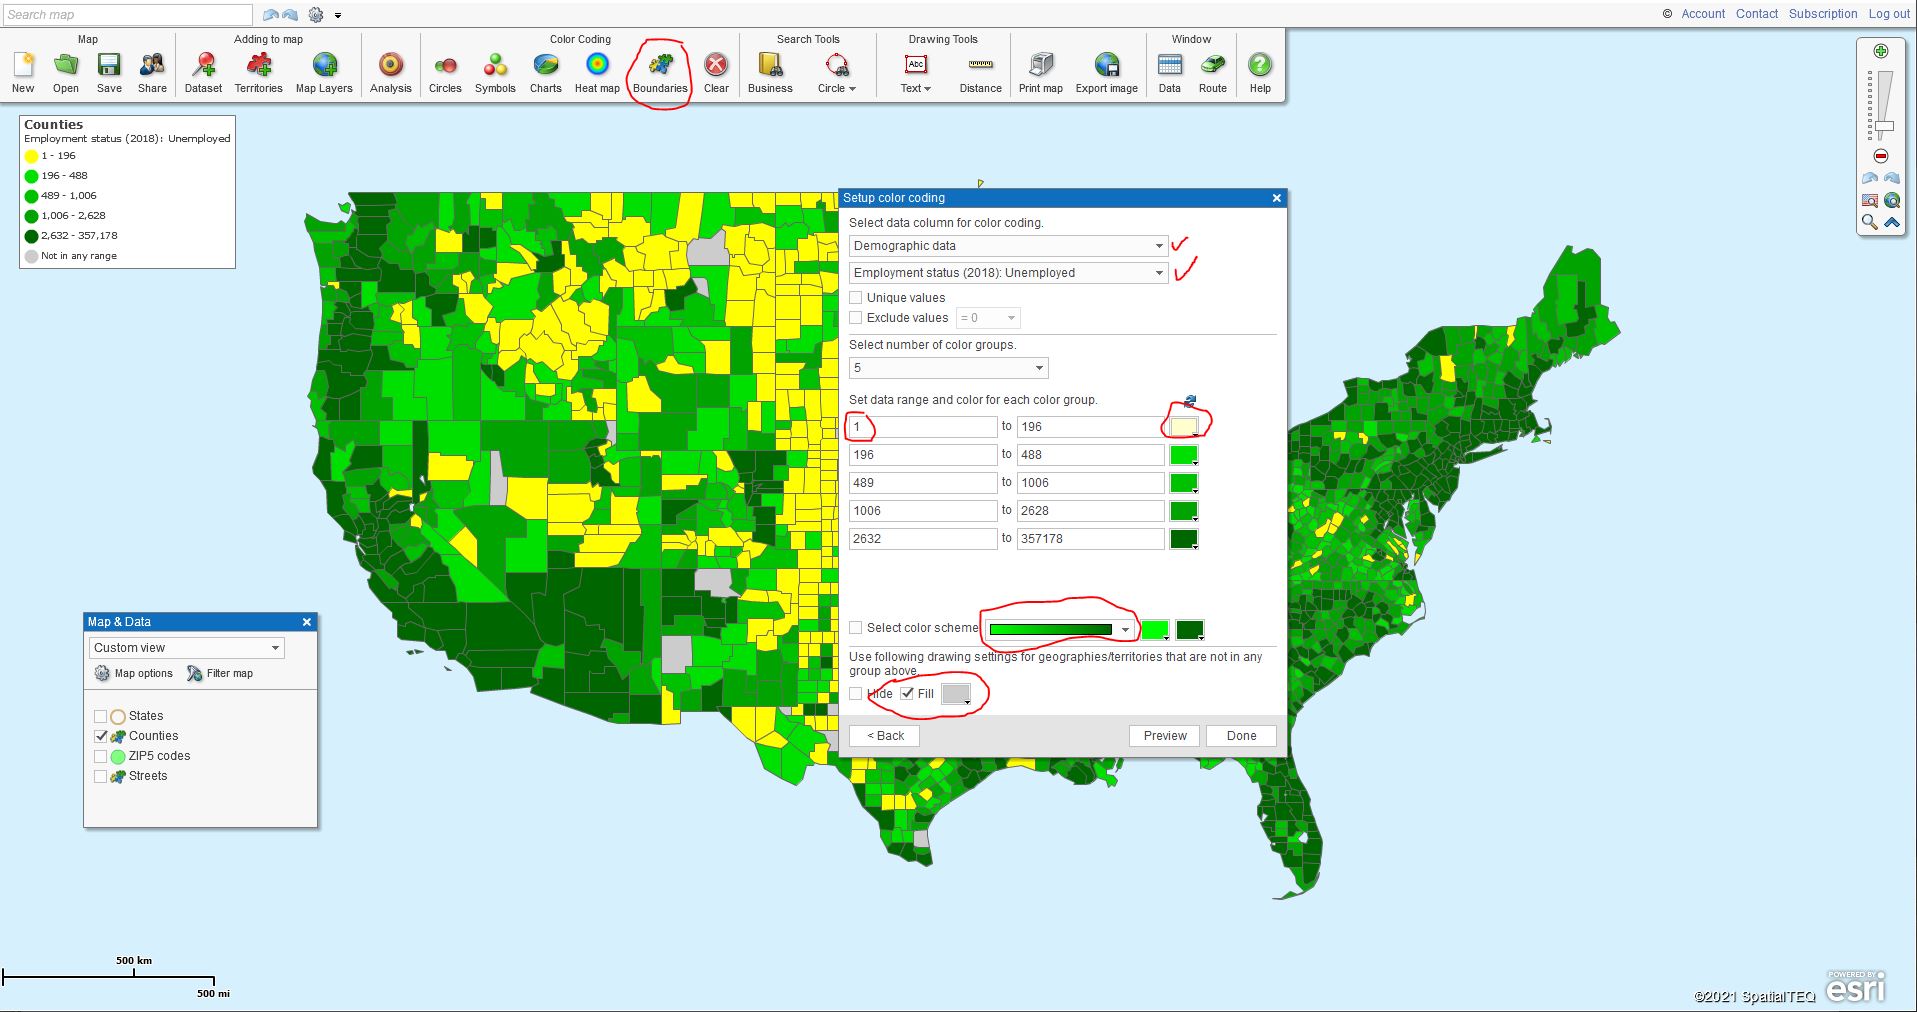
Demographic Mapping Set-up in MapBusinessOnline

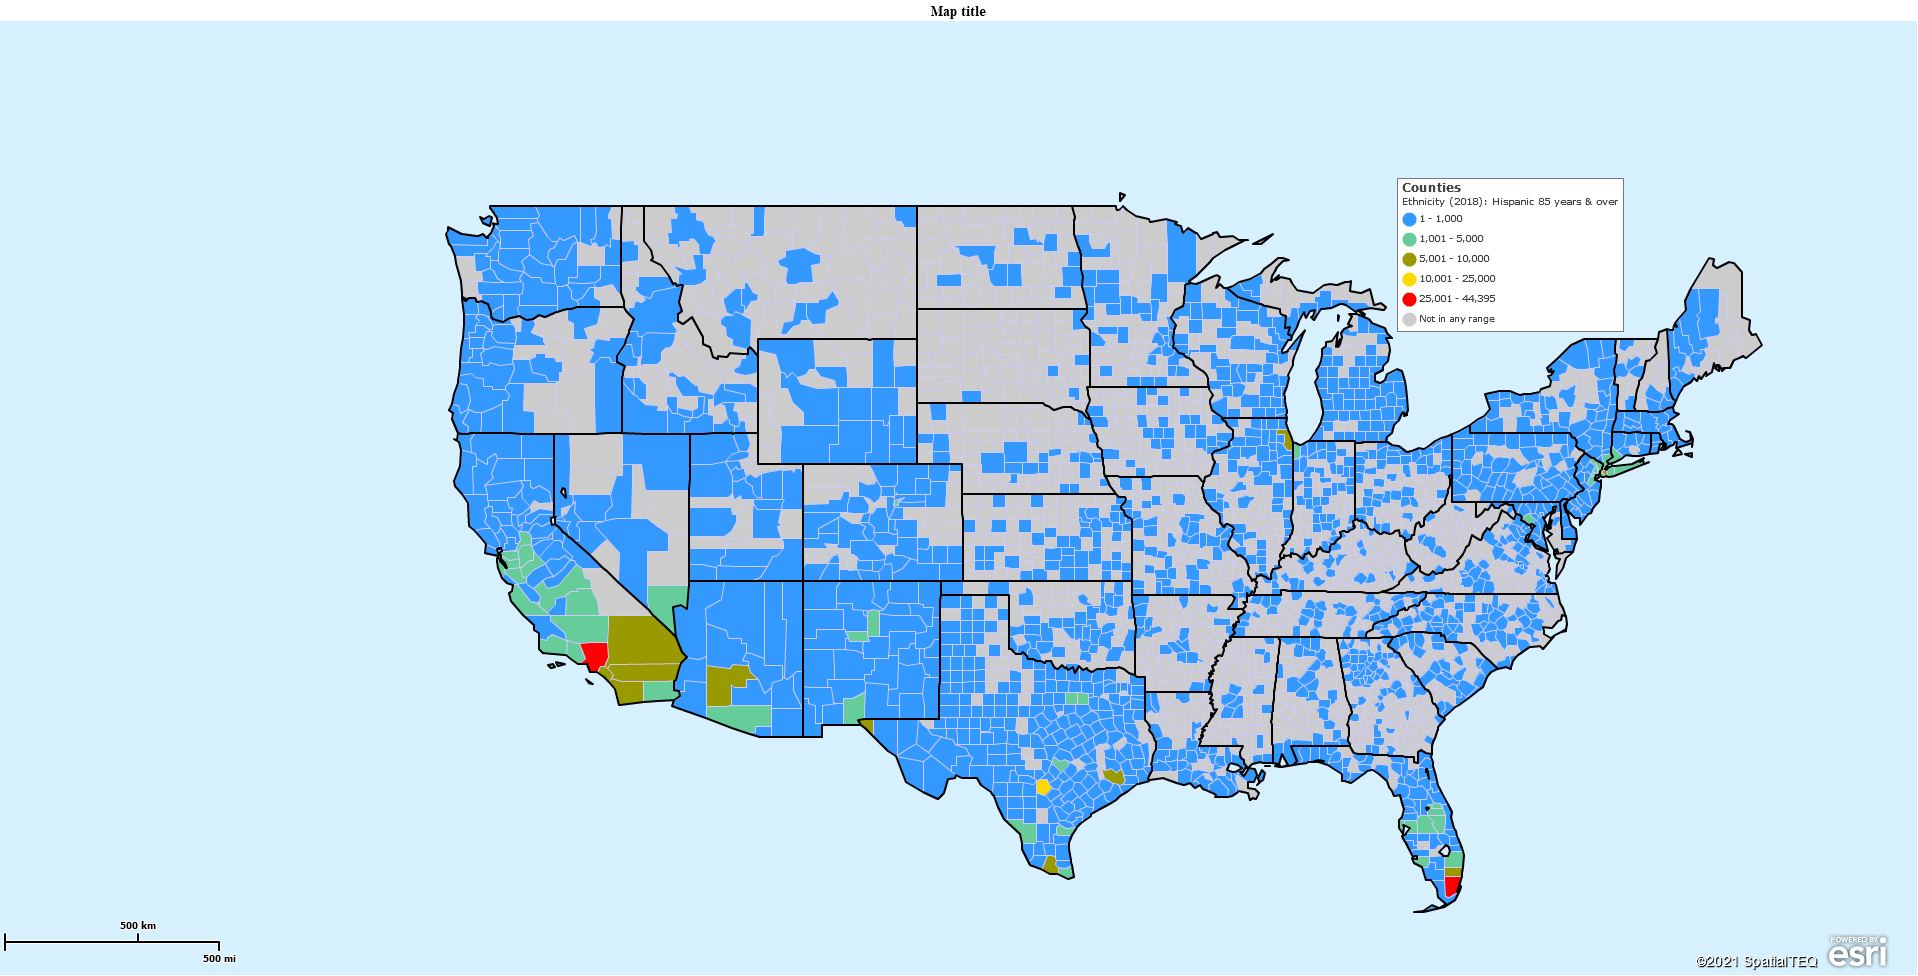
Demographic Map using ‘2018 Employment Data’ in MapBusinessOnline
View the demographic map for a minute. Notice how the Yellow areas nicely reflect the least unemployed counties. In this map, that lowest ’employed’ rate could be the most important color group, depending on your map’s purpose. So, it’s nice to make the layer your want to emphasize more obvious. Here we made that color group stand out with a pale yellow.
Notice also how the gray gently displays counties with no data. The gray counties are sparsely populated areas that Zombies have taken over. Zombies are always color-shaded gray in business mapping.
Find the Map Legend. Drag the legend box to the area above New York state, which offers a perfect out-of-the-way legend placement nestled between Michigan and Maine. Click the Legend Edit Gear in the upper right corner and uncheck the State layer. It’s not necessary and clutters your legend. Always place your map legend where it doesn’t impede map viewing yet remains a prominent information source.
If you view the map and drink in the data, you will see the darker greens reflecting more unemployment in 2018. You should be able to see the county boundaries. You can adjust the boundary layer in Map and Data to be more noticeable. You might make it a lighter color to stand out against the predominantly dark green color. That’s a personal preference mapping decision.
Where Are All the Old Hispanics?
Funny you should ask. Let’s find out. Using the same map and set-up you ended up with, Dropdown and scroll up to Ethnicity (2018): Hispanic 85 years & over. You’ll see multiple age groups listed, but let’s just select the oldest group of Hispanics.
This time you’ll note that MapBusinessOnline’s suggested range and coloring is whacky. We need to decide what to do for ranges and colors. The bottom-most color group displays the highest numeric value of Hispanics in one county – 45,395. Use that number as a target maximum by county for your color scheme.
Five Color Scheme Spread
- 1 to 1,000 – Blue
- 1,001 to 5,000 – Pastel Blue-green
- 5,001 to 10,000 – Pastel Green
- 10,001 to 25,000 – Pastel Yellow
- 25,000 to 45,395 – Bright Red
My selected numeric range above is how I like to manage color groups for general mapping. It’s balanced between sparse population and dense. It covers all numeric options. Be careful not to leave out a numeric segment. I like to number subsequent numeric ranges with the following exact number – 1001 to 5000. It feels more accurate than starting where you ended – 1000 to 5000.
Color-wise, for this map, I was not too fond of the Green graduated shading.. I choose the multi-color color scheme. Make sure to check the check box associated with Select Color Scheme. Then adjust your color boxes to reflect what I have noted above. I have bright Red as the color for the most significant number of Older Hispanics. The rest of the colors are simply supportive, and pastel shades make them easy on the eyes.
Process your demographic map color-shading by clicking done.
Review the Hispanic 85 Years and Over map. Although not surprising, I thought it was interesting to see the two red areas – one in Southern California and the other in Miami-Dade county Florida.
I added the Hispanic 85 Years and Over category to my map’s County Custom Labels for fun. Custom Labels in MapBusinessOnline are the pop-up labels that occur when you point to a county (state or ZIP code.) Here in Maine, in Piscataquis County, there is a quantity of 7, 85-year-old, and older people of Hispanic descent. Good to know. Piscataquis County Association of Hispanic Americans.
This process gets you familiar with the MapBusinessOnline demographic mapping process. Now you can build your map and search for other ethnicities or economic categories on your own time.
MapBusinessOnline users apply demographic mapping to sales territory analysis, market analysis, political mapping, and strategic planning. The list goes on and on.
Once the pandemic is over, I’m headed up to Piscataquis County to find those old Hispanic citizens and verify the Census count, and apologize for the Rick Roll.
_______________________________________________
Find out why over 25,000 business users log into www.MapBusinessOnline.com for their business mapping software and advanced sales territory mapping solution. The best replacement for Microsoft MapPoint happens to be the most affordable.
To access MapBusinessOnline, please register and then download the Map App from the website – https://www.mapbusinessonline.com/App-Download.aspx.
After installing the Map App, the MapBusinessOnline launch button will be in the Windows’ Start Menu or Mac Application folder. Find the MapBusinessOnline folder in the Start Menu scrollbar. Click the folder’s dropdown arrow and choose the MapBusinessOnline option.
The Map App includes the Map Viewer app for free non-subscriber map sharing.
Please read customer reviews or review us at Capterra, or g2crowd
Contact: Geoffrey Ives geoffives@spatialteq.com or Jason Henderson jhenderson@spatialteq.com