
Click the Create New Map button on the far left of the MapBusinessOnline Master Toolbar.
Don’t even look at the map. Go to Map and Data and uncheck the background Street Layer. Now, look at the map. What do you see?
You should see a blank blue background and nothing else—a nudey-kazoo map – completely naked.
Think about your map requirement. Take a minute to gather your thoughts about what you want the map and the message you will communicate to your map audience. Next, just breathe. Good thing I reminded you to do that, huh?
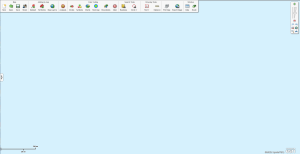
“Blue. Blue. My Map is Blue.”
Business Mapping Software offers a geographic toolkit that a subscriber uses to develop a map-based message for her map viewers. We are forced to consider what layers are most appropriate for the map project at hand by starting with nothing.
Select a Map Layer
Map and Data is the gray box that hovers over your blank blue field of view. Map and Data provides checkboxes that turn on the various layers that constitute your business map.
Turn on the ZIP Code layer only.
Your field of view should now display the complete boundary ZIP code layer of the contiguous United States. Boundary ZIP codes account for most of the ZIP codes – but not all. Read more here.
Demographic mapping and ZIP code mapping add value to a business map. At the full USA Zoom view level, ZIP codes do not provide a lot of value because each ZIP code represents a small area. So, zoom in to a section relevant to your map’s purpose. Consider color-coding the ZIP codes based on a demographic category of data related to your subject matter.
Color-code Boundaries
If your map is retail-related, select a Consumer Expenditure category like Housekeeping Supplies, which estimates the average household’s dollar value spent per year on cleaning supplies. Color code the map using that category. For instance, click the Border button under Color-coding, select the ZIP code layer, and scroll through the categories of demographic layers.
As you process the color-coding, select a range number set between 3 and 5—no reason to start higher unless you have a particular color analysis in mind. Too many colors will tend to detract from your map’s purpose.
Choose a few color gradations that suit your map with your range number presented. It’s easy to reprocess, so jump right in. MapBusinessOnline prefills the range numbers to show a spread between zero and the largest value associated with a ZIP code. I usually reset the numbers to reflect more standard numeric ranges such as:
- 1 to 250
- 251 to 500
- 501 to 1000
- 1001 to 2500
- 2501 to 5000
Try the above range and get a sense of how that scheme appears on the map. Look for differentiating factors. For instance, I chose 5 ranges at first in shades of orange to red. But upon reflection, I went back and decreased to 4 ranges splitting it thus:
- 1 to 500
- 501 to 1500
- 1501 to 2500
- 2501 to 3000
This range offered more meaning for me as a map viewer than the first view. If you were an expert on the retail household supply business, you’d adjust those ranges and colors based on your awareness of the market.
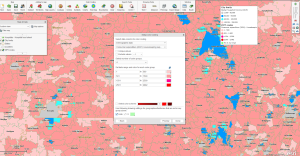
Color-coding ZIP codes based on Demographic Data in MapBusinessOnline
By the way, the Map Legend on your map will now reflect your color-coding selection. You will notice a section in the legend for Not in Any Range. I usually just erase that in the Map Legend. But you could also remove it at the bottom of the Boundaries Color-coding dialogue. Select Hide. Of course, you could also leave it there if you think that it adds value to the map.
Hint: Always be accessing the value of your map. Consider the value of every aspect of your map. Does your map communicate the right message to the map viewer?
Additional map layer options are available in the Map Layer button under Adding to Map. Check out census tracts, city limits, MSA (Census Bureau Metropolitan Statistical Areas), and ZIP 3 codes. Perhaps not one of them enhances your business map. In which case, you should import some relevant location data.
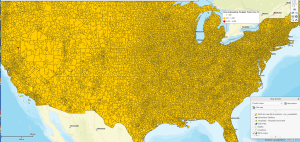
Here, the color scheme doesn’t tell us much about housekeeping supplies
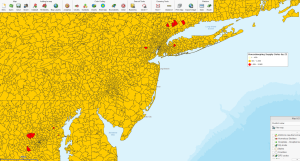
Zoomed in however we see some serious housekeeping action in a few ZIPs. Weird.
Import Relevant Location Data
You are creating a business map that defines or helps identify problems. Location data imported into a business map can provide insights into the roots of a business problem. Hopefully, the genius who appointed you is also providing some location data to support your project.
A simple example could be a business map describing sales declines. Revenue totals by account address are imported onto the map. Map viewers can examine year-over-year sales. All declining year-over-year trends are colored red. All increasing sales are colored black. All accounts holding steady are blue. The map reveals almost all areas as staying steading or increasing except for one area of decreasing sales, which turns out to be the largest account of all. Problem identified.
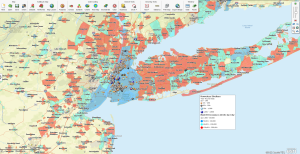
A Zoomed-in Relevant Map
Search for relevant location data online. Industry groups and non-profit organizations often share resource location datasets. Look for datasets with full addresses or latitude-longitude coordinates – not just ZIP codes. Where possible, select data that includes columns of relevant associated data like sales, hospital beds, and trends up or down. MapBusinessOnline always provides a count.
With relevant location data imported onto the map, the map creator should focus on making sure that imported data supports the map purpose. Check symbology options and color-code those points in a meaningful way.
These are your primary tools for creating a business map that sings.
- Select a map layer that supports your map’s intent.
- Color-code the map layer(s) with demographic data.
- Import relevant location data over the map layers.
- Optimize to your taste, and serve.
Find out why over 25,000 business users log into www.MapBusinessOnline.com for their business mapping software and advanced sales territory mapping solution. The best replacement for Microsoft MapPoint happens to be the most affordable.
To access MapBusinessOnline, please register and then download the Map App from the website – https://www.mapbusinessonline.com/App-Download.aspx.
After installing the Map App, the MapBusinessOnline launch button will be in the Windows Start Menu or Mac Application folder. Find the MapBusinessOnline folder in the Start Menu scrollbar. Click the folder’s dropdown arrow and choose the MapBusinessOnline option.
The Map App includes the Map Viewer app for free non-subscriber map sharing.
Please read customer reviews or review us at Capterra, or g2crowd.
Contact: Geoffrey Ives geoffives@spatialteq.com or Jason Henderson jhenderson@spatialteq.com