
One possible market analysis scenario, requiring both Map Business Online Pro and Business Listings, is a retail manager planning for a new set of convenience stores along the I-95 corridor in Eastern Virginia. Such analysis using Map Business Online would tap into Business Listings search as well as the drive-time-based Market Analysis tools now available in Map Business Online Pro.
Let’s begin with no Background Map selected in Map Business Online. Instead, we’ll use a Census Tract background colored purple to highlight store locations. By selecting the highway layer from the Add Map Layers button your map will reflect the major highways, important to this analysis view. Read more about Background Map options.
A user could turn highway layers off and display the Imagery Background layer which may display aspects of your proposed new convenience store locations that could be hidden by the roads layer. Check the highway layer on and off and Zoom way in to verify your proposed site locations. Are there buildings, exits, or mountains nearby? But for the final map view, a color shaded map layer background may be more effective.
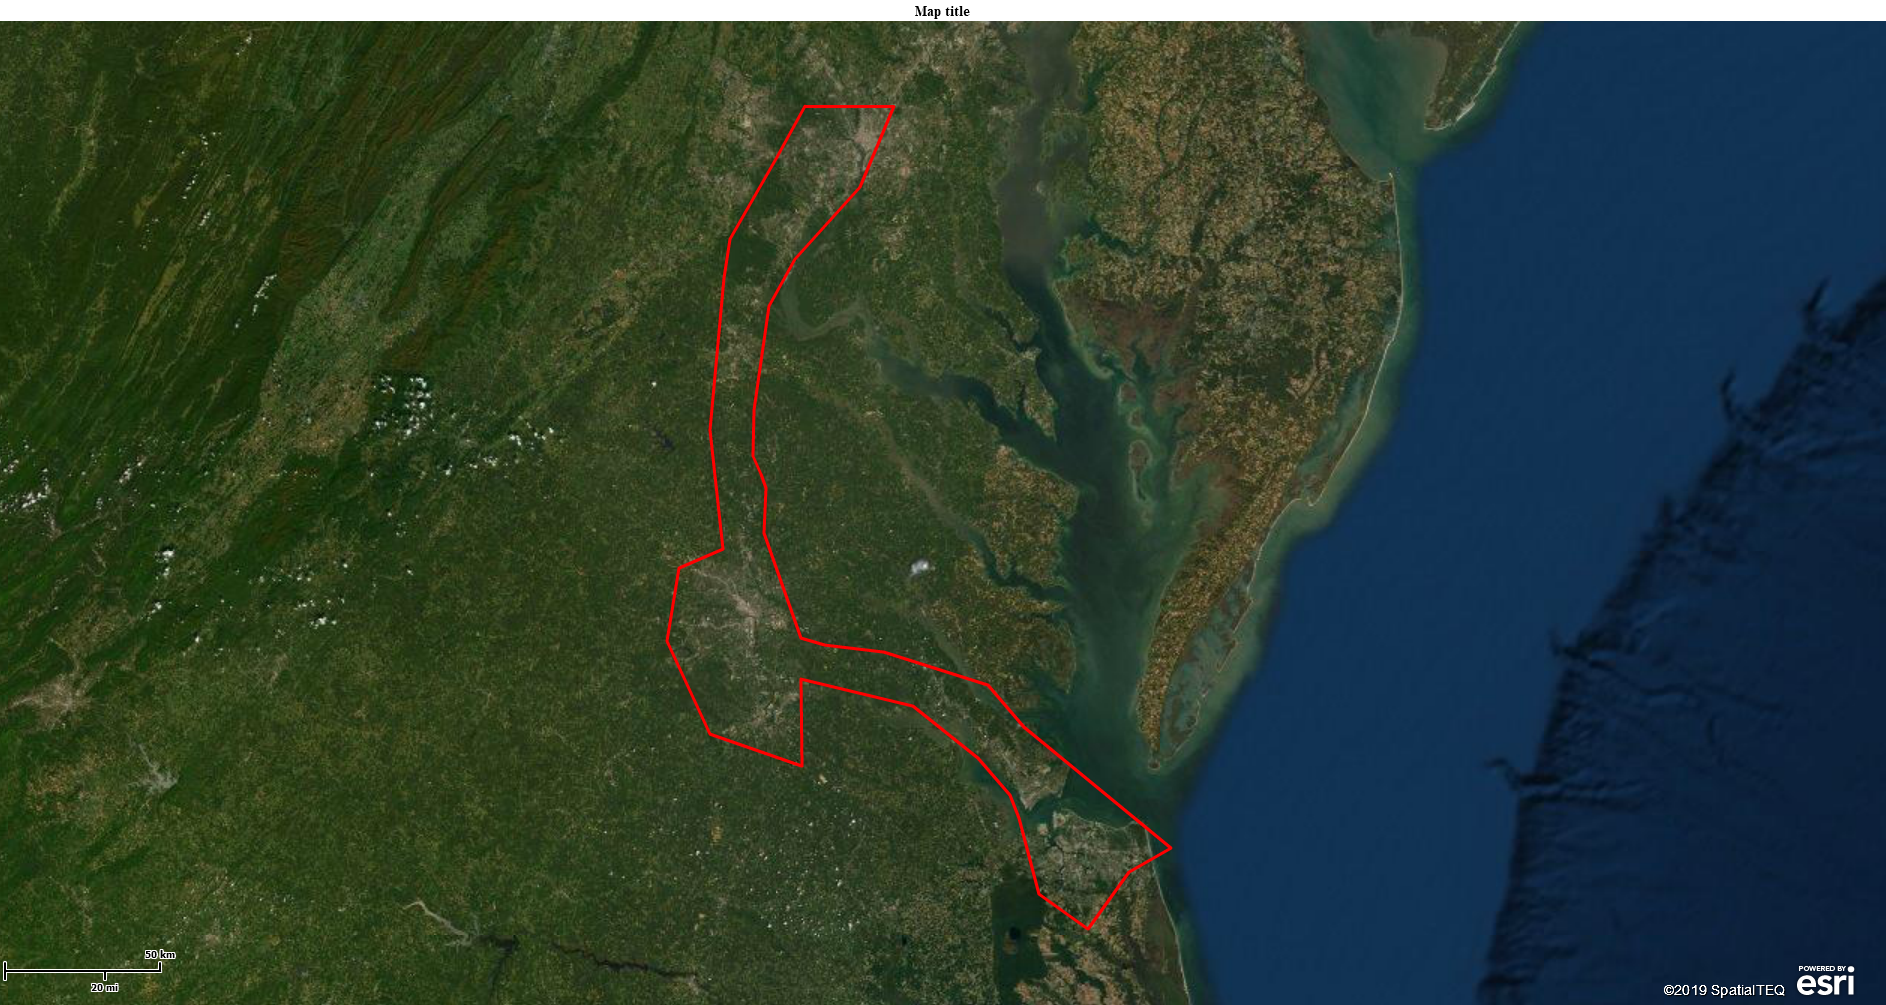
Satellite View DC/VA I-95 Corridor
Over that pink map background, with the highway layer turned on, is a drawn polygon, created to represent a rough buffer zone around the I-95 corridor from Washington, D.C. to Virginia Beach, VA.
No Background Map – Colored State Layer
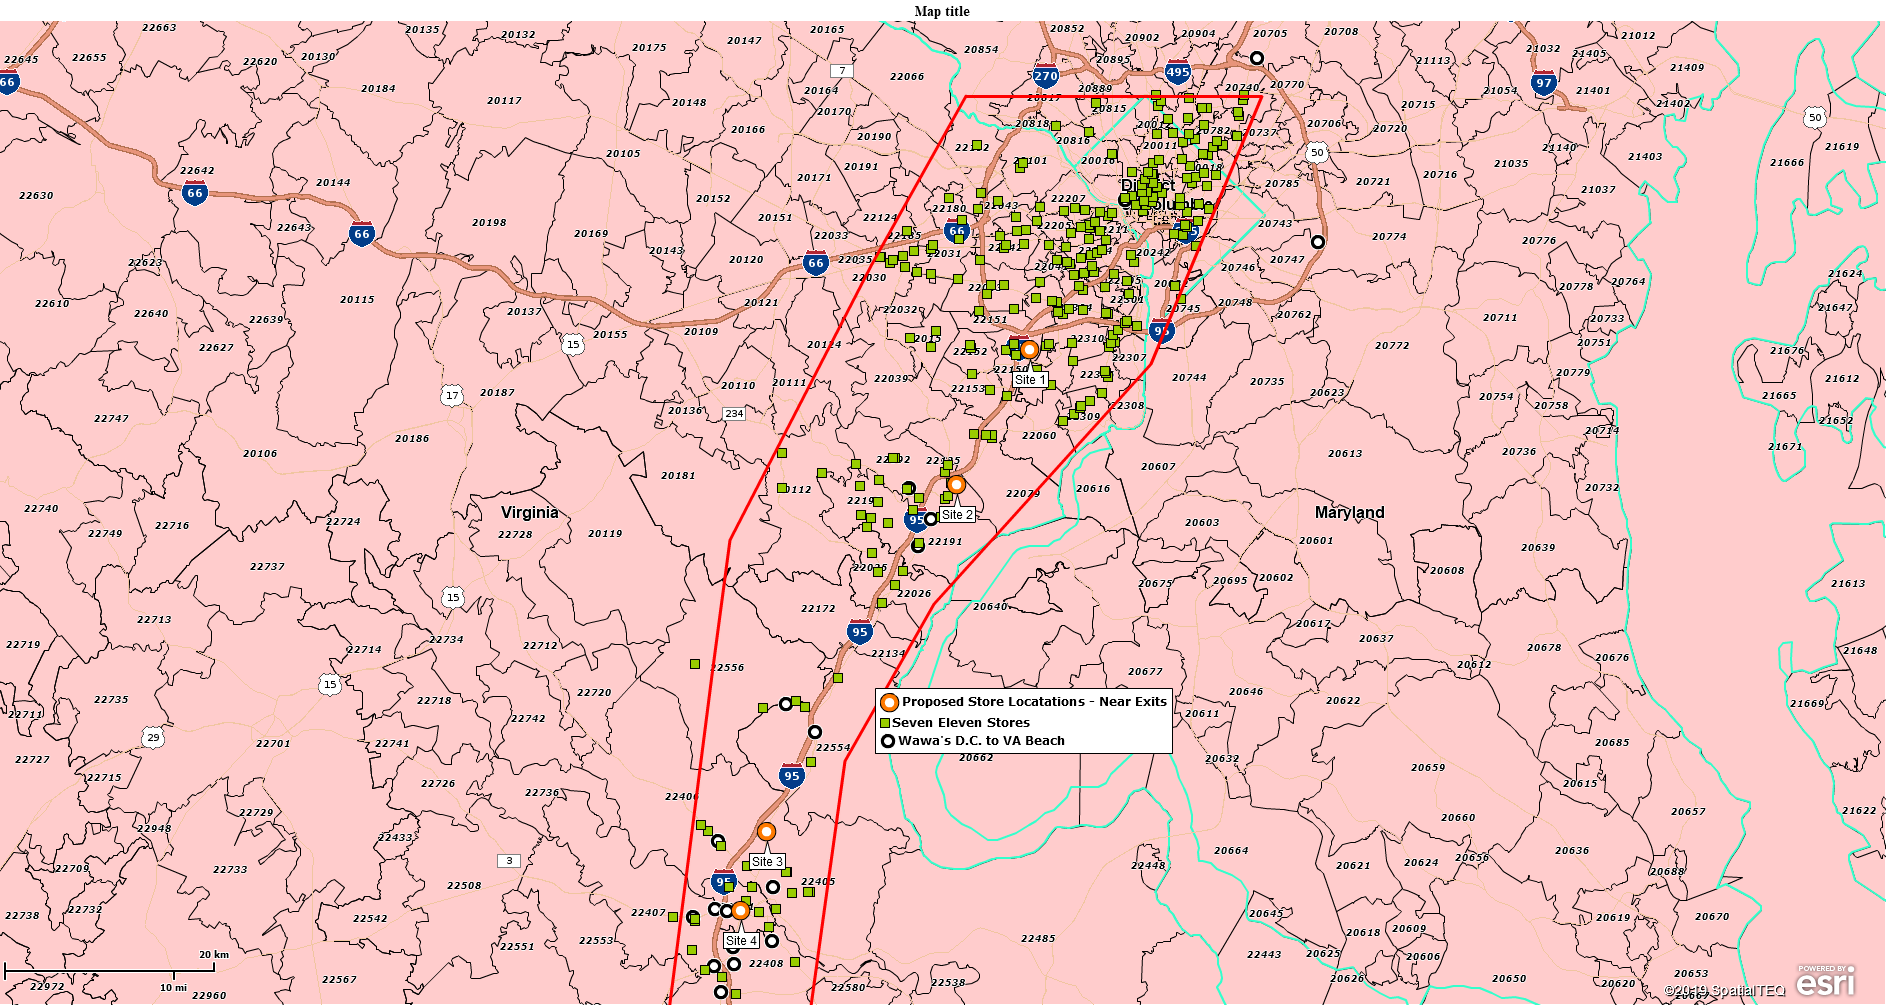
Remember, our map audience for this map project are the developers of a new set of convenience stores. They are interested in opening a series of convenience stores near I-95 exits in Virginia. As part of that market analysis, we need to understand more about the existing competition. And there is plenty of that, including multiple 7-Eleven and WaWa stores located in close proximity to the highway. Market analysis must answer the question, “Does this even make sense?”
Business Listings
All Map Business Online subscriptions now include access to business listings. So, a next step would likely be to select the Polygon buffering the I-95 corridor and choose the Yellow Pages icon located on the Polygon’s mini-toolbar for a Business Listings search for competitor locations.
Doing so will reveal a little more than one-thousand 7-Eleven stores and about seventy WaWa stores. Keep in mind, that’s 1,000 7-Eleven stores in the Virginia I-95 corridor alone. Yikes!
With the map now populated with the major competing stores, we can assess how many competing stores exist within a specified drive time of all our proposed store sites. With Map Business Online Pro a user could assess both straight line, driving time and driving distance, but with so many stores in the area, I felt driving time was the most appropriate analysis.
The proposed job sites are located close to key exits along the I-95 corridor. They are displayed on the Map as large orange circles with white doughnut holes. We’re interested in locating those stores only where there are less than three 7-Eleven stores within a five-minute driving time. Driving time is important. I know for me, when I must exit the turnpike to get gas, coffee or food, I want to minimize the time I lose from my trip. I’m not going to get off and drive for more than five-minutes.
Map Business Online Pro – Market Analysis
Using Map Business Online Pro, we choose the option in Market Analysis called Find the Nearest. Following the options listed in the dialogue box, we choose the following:
- Measure – Drive time
- Customer Locations – 7-Eleven store dataset
- Store Locations – Proposed convenience store locations
- Time – 5-minutes from 7-Eleven to the proposed site location
The results of this analysis, displayed in the Data Window, will add Site Location data to the 7-Eleven dataset based on a Drive time of under five-minutes. Negative numbers indicate 7-Elevens that fall outside the range of the Find the Nearest parameters. Filter the Drive Time column to show only results that are greater than zero (> 0). Now, still in the Data Window arrange all the Proposed Sites in order and view the sites with the fewest competitors. These include Proposed Site 4, 5, 6, 7 8, 9, and 14.
Multiple Drive Time Territories
Another approach to investigating the areas surrounding a list of multiple center points, or proposed sites, is to build a set of territories around those locations and then pull data into the resulting analysis using the More Data button. Read more about More Data.
The combined elements of assessing multiple center points based on drive time areas require Map Business Online Pro. Use the first option in Market Analysis. To keep the territory map layers smaller, I would turn on the Census Tract layer which generally has tinier jurisdictions than ZIP codes. Census Tracts are available in the Add Map Layers button.
Choose Search and Segment Data from Multiple Centers in Market Analysis.
- Select or Plot Dataset – Proposed Site Locations
- Use – Drive time
- Radius – 5 minutes
- Checkbox – To draw a drive time polygon
Click Next [note the routing credits used for this process] click Next again. In this final dialogue page, to create territories or marketing lists it is important that the user chooses to Segment the data by checking the Segment Checkbox underneath the Dialogue.
- If you choose to segment a point layer to query, marketing lists are generated.
- In our case, select a Map Layer option, Census Tracts, to generate territories
Process the analysis by clicking Next. With a territory layer now created, use the More Data button in the territory analysis view to remove superfluous data layers and add data layers you find valuable. Results can be export and saved within Map Business Online for further analysis, or for data enrichment, another feature of Market Analysis.
Use Map Business Online Pro as a market analysis toolkit. Try different approaches. Every company has a slight twist to market analysis that is all their own.
Many of the features and applications associated with Map Business Online are interelated. Market Analysis helps with and benefits from sales territory management. Demographic analysis is one component of market analysis and a key element of sale territory management and competitor analysis. Business listings can be critical to a sales or marketing campaign while also providing key factors in strategic planning.
I guess the message is, maps are really helpful in business analysis and planning.
Are you using the Map Business Online Desktop App for MAC or PC? It’s hipper than Instagram and it comes with your subscription. Escape Web-Browser Tyranny!
Value-Added Resellers – Offer the tool to your customers as a reseller. Make money on training and consulting. Contact us with further interest in reselling Map Business Online.
Win a $20 Gift Card! Refer a business associate to Map Business Online in exchange for a $20 Amazon Gift Card!
America’s best geo mapping software.
Find out why over 25,000 business users log into www.MapBusinessOnline.com for their business mapping software and advanced sales territory mapping solution. The best replacement for Microsoft MapPoint happens to be the most affordable.
Discover Map Business Online – tools for making business maps