Marketing Maps are a common application of business mapping software. Marketing maps provide a variety of business perspectives, any one of which holds value to the company creating and using the map. Marketing maps can identify market potential, define threats and opportunities, or just outline a marketing campaign geographically. But these map perspectives can get a little overwhelming at times, especially to new users of business mapping software or audiences who are not used to viewing maps.
Keep in mind, business maps are a composite of a variety of visual data. As such, these maps can quickly reach a layer-over-load stage if not managed appropriately. In MapBusinessOnline you can bring twenty plus layers to bear on your map pallet. Try to use each layer judiciously.
Learn More About Map-based Market Analysis
Here’s a few of commonly used maps layers that add value to market analysis maps:
- State layer – An MapBusinessOnline map layer, typically with the state fill turned off because this layer is often used for reference and orientation
- ZIP code layer – An MapBusinessOnline map layer used to designate areas of interest, territories, and for color shaded visualizations of demography or other imported data
- Demographic data for color shading – included with MapBusinessOnline covering multiple years and hundreds of categories from the Census Bureau
- Imported user data – customers, prospects and sales reps – anything pertinent to your business that has a location component in the data
- Imported industry business data – NAICS industry segment data or industry group data – see RealDatasets
- Imported territory data – spreadsheets of counties, states or ZIP codes – preassigned to a territory name. Territory mapping can at times constitute a marketing map.
Preparing to Create a Marketing Map
When creating a business map for marketing analysis give some consideration to that array of data you have available or can procure. Look over the data layers to make sure location components exist and are accurately assembled. Look for columns in your data that you can use on the map to create color shadings, point/symbol color codes, or heat map layers.
Think about the reason you are creating your business analysis. What are your goals? Getting clear on why you want to invest time and effort into building a map can help you create a more valuable map. Keep your goal in mind through out the process of creating a marketing map.
Think about who’s going to view your marketing map. What kind of viewer are they? Are they patient and inquisitive? Or are they pressed for time and looking to get spoon fed information quickly.
To the Map! Batman
Back at MapBusinessOnline, start importing your data layers. Import as many as you feel are relevant. The upper limit on the number of separate datasets per map is twelve. You can import up to 100,000 records per map. So, try to consolidate like datasets – such as customer files. Avoid importing a bunch of smaller, separate customer files – consolidate.
As you import your files, make them map worthy by adjusting a few things:
- Assign Readable and Politically Correct File Names. In MapBusinessOnline click on the imported data file in Map and Data and adjust the name of the dataset so it reads well on the map. When your boss is reading your map, you don’t want a weird name to show up on the map. So, change names like: That Stupid Map File I Hate to read something more like YTD Registered Users.
- Make your map easy on the eyes. Choose a symbol you feel good about and adjust its size so that it is easy to read but doesn’t cover up other stuff on the map. Tweak the colors to match your map view. Avoid bright and obnoxious colors. Loud colors and huge symbols distract from your map intent.
Imported data points are likely to be critical for your map’s purpose. Consider using a key imported data set to color shade a map layer instead of a point layer. Rather than show all sales for 2016 as points on the map, it might be wiser and easier on the boss’s eyes, if you color shaded the ZIP codes based on imported sales data. Just consider it. It may not work for your map. It’s easy to try in MapBusinessOnline. Ask a colleague what they think.
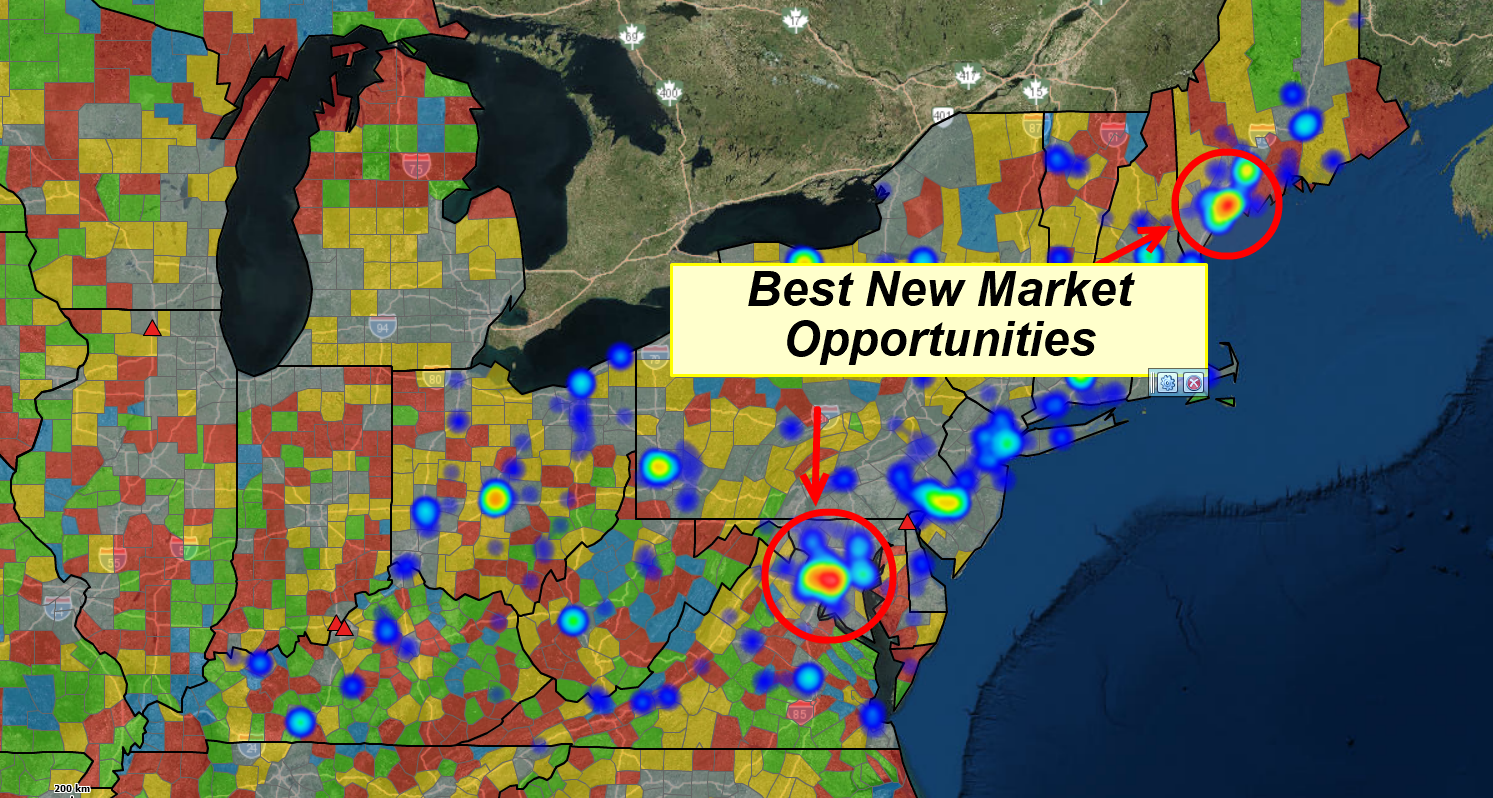
Save your most important numeric layer for a Heat Map layer. Heat maps are all drama. So, if there’s a layer of your data that just screams, “Marcia, Marcia, Marcia!” save it for the heat map layer. That’s the layer that says, “Hey Boss! See all this color and intensity? Pay attention or we’ll all lose our jobs.” Let the map scream the drama, not you.
Dumb It Down
Most people, when they first build a map, love showing it off. They’ll turn on every layer, with bright colors and thick borders. Their proud of their work and they want the world to know it. Unfortunately, the world doesn’t care. Remember – What’s the reason you built this map? Stay focused.
Consider turning off most of your map layers. Let the map tell a story as your turn on layers for your audience. Let that skunky suck-up point out you’re missing a key layer, and then you just click it on. “Oh, Snap! That’s where those sales are.”
Try to tell your marketing map story by only using a few of the layers you’ve imported. Keep the others in reserve for follow-up questions or more detail. Remember, too many layers can undermine your map point. Especially if you’re presenting to a larger group. Keep it simple.
Practice your map presentation. Make sure you understand what all those layers represent and how they relate to the geographies you’ve chosen. By this I mean, if your business uses ZIP codes to define territories, then by all means build your territory maps using ZIP codes. If you import demographic data into your ZIP code map, think about the demographic totals and their relationship to the ZIP code. Population is usually presented as people per ZIP code. Income can be average incomes per ZIP code. Ages may show as the population of a certain age by ZIP code.
Build Another Map
If your marketing map is getting too crowded, you may simply require more than one map to achieve your goal. For instance, your territory map by ZIP code may be critical to the conversation. But you also want to show product distribution and customer distribution by county. It’s may make sense to have two separate maps. Or save your first map as a template, then create an offshoot of your first map for differing views.
It’s easy to create new maps and templates in Map Business Online. Take advantage of the application.
Add Text to the Map
Map Business Online provides plenty of places for your marketing map to describe itself. Text on a map helps people understand what they are seeing. The MapBusinessOnline map legend is entirely editable. Adjust your data labels to reflect marketing categories and names. Eliminate redundancies in your legend. Delete empty values like other.
Add a map title text to the map – relate that title to your reason for building the map in the first place. Map titles are located in Map & Data – click the menu edit gear, you’ll find map title control there. You can also add map notes using the Draw Tools – see the button labeled “ABC.” Best of all, you have five flexible fields associated with all geography layer labels, including territories. The flexible fields associated with map layer labels adds places to aggregate data or pull labels from imported data fields.
Share Your Marketing Map
Maps are for sharing. MapBusinessOnline has a variety of ways to share maps. The most useful sharing technique for marketers is the interactive map sharing capabilities. Publish your map through MapShare and provide your viewers with a marketing map they can review at their leisure. They’ll simply click on the link you send and launch a simple version of MapBusinessOnline. They’ll be able to pan and zoom, query, and route – but they can’t edit the map.
Marketing maps help businesses plan for future growth. Marketing maps are important. Use your best judgement when building your marketing map. Don’t overwhelm the viewer. Experiment with a variety of symbolization and map layering schemes. Treat each marketing map as a small step toward achieving company objectives.
And remember what Don Draper of Mad Men said: “Advertising is based on one thing: happiness. And do you know what happiness is? Happiness is the smell of a new car. It’s freedom from fear. It’s a billboard on the side of a road that screams with reassurance that whatever you’re doing is OK. You are OK.”
So now, your map is OK.
Send us your unique business mapping application, we’d love to do a story on it.
_______________________________________________
MapBusinessOnline access has officially transitioned from Web Browser (Adobe Flash Player) access to the Map App download access.
- Please download the Map App from the website – https://www.mapbusinessonline.com/App-Download.aspx.
- After installing the Map App, the MapBusinessOnline launch button will be in the Windows’ Start Menu or Mac Application folder. Find the MapBusinessOnline folder in the Start Menu scrollbar. Click the folder’s dropdown arrow and choose the MapBusinessOnline option. You can drag the icon to the taskbar for a quick launch button.
- All saved maps will be available through your Map Library Folder, the second button in from the left on the Master Toolbar. (Green File Folder icon.)
Map App access to MapBusinessOnline.com provides enhanced features and a better user experience.
The Map App includes the new Map Viewer app for free non-subscriber map sharing.
Value-Added Resellers – Offer the tool to your customers as a reseller. Make money on training and consulting. Contact us with further interest in reselling MapBusinessOnline.
Find out why over 25,000 business users log into www.MapBusinessOnline.com for their business mapping software and advanced sales territory mapping solution. The best replacement for Microsoft MapPoint happens to be the most affordable.
Please read customer reviews or review us at Capterra, or g2crowd
Contact: Geoffrey Ives geoffives@spatialteq.com or Jason Henderson jhenderson@spatialteq.com