
MapBusinessOnline Standard and Pro offer various business mapping tools that many companies use to generate map visualizations, navigate using optimized routing, build demographic thematic maps, and conduct map-based market analysis.
The list of business mapping software capabilities is extensive:
- Batch Calculate distances and times between datasets.
- Business Listings search.
- Calculated data columns.
- Collaborative map editing.
- Concentric circle mapping.
- Crime mapping.
- Customer mapping.
- Import and color-coded business location data.
- Dot density mapping.
- Draw tools for map object creation.
- Demographic mapping and analysis.
- Field staff management.
- Find the nearest – Proximity search.
- Heat mapping overlays.
- Large format PDF printouts (Wallmaps).
- Location database overlays.
- Map-based market analysis.
- Map print and image generation.
- Map sharing.
- Optimized vehicle routing.
- Optimized map visualizations.
- Personal mapping.
- Political mapping.
- Sales territories by region and division.
- Sales territory mapping.
- Thematic map creation.
- ZIP code mapping.
I have written about all of these tools to some extent. This time I’d like to discuss how a user can combine three or more of these tools to solve a business problem.
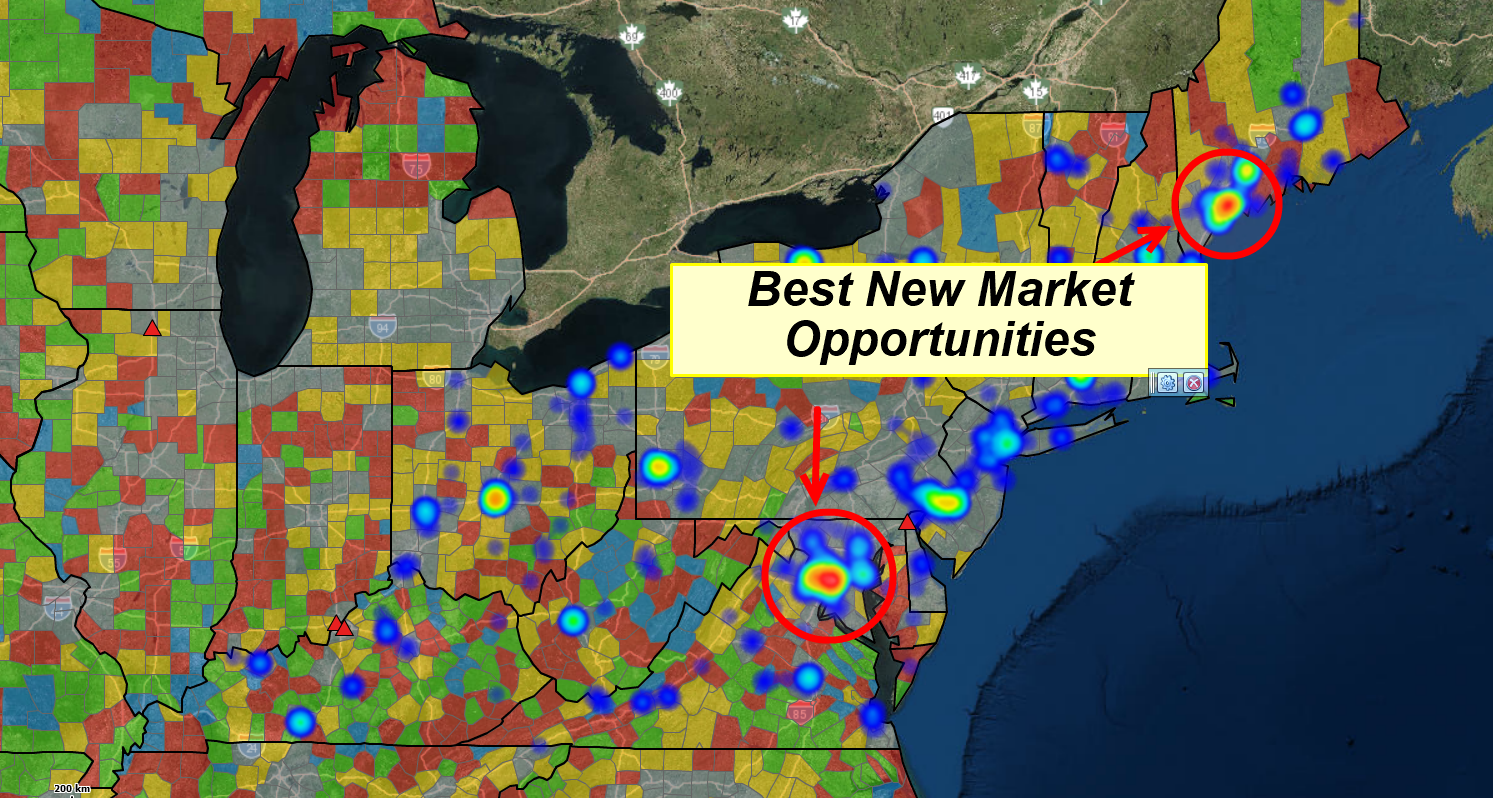
I am using MapBusinessOnline to identify market opportunities.
Map-based Market Analysis
It’s difficult to say when demographic mapping becomes full-on market analysis. Perhaps when the map creator taps three or more business mapping functions to create marketing studies.
It is easy to say that when a company requires market analysis, it’s generally indicative of growth problems, expansion challenges, or other sales and marketing-related obstacles.
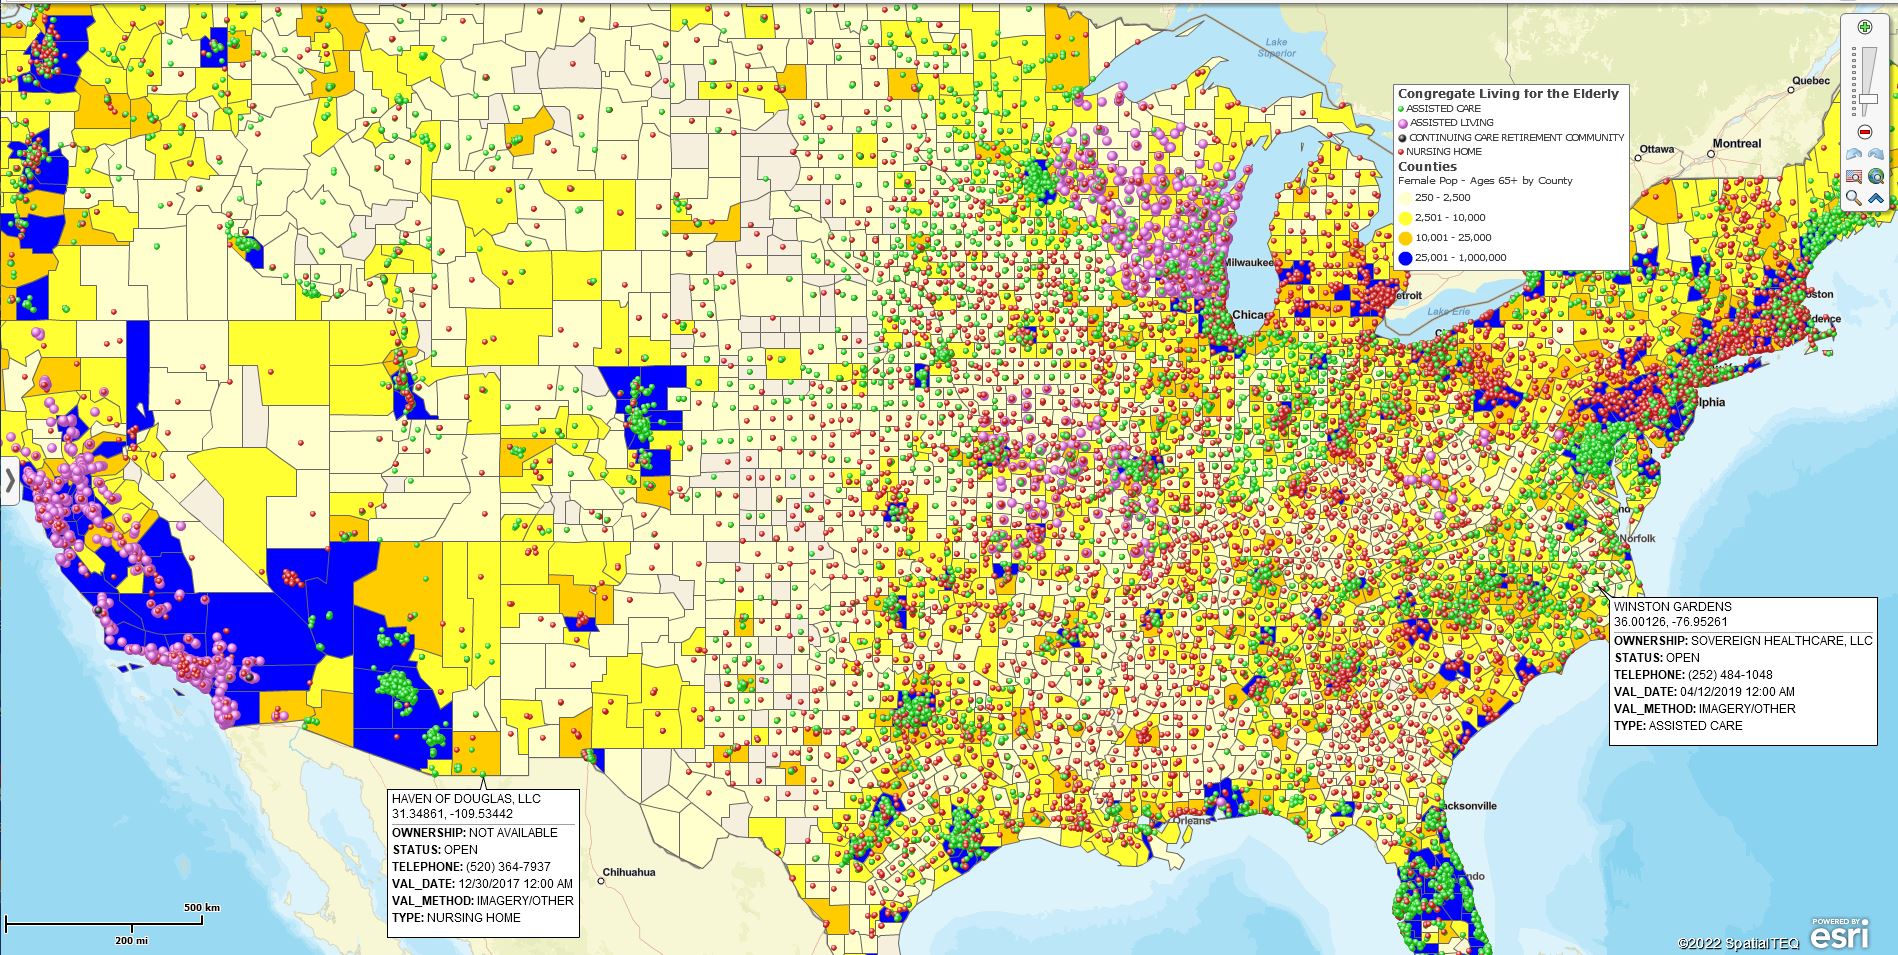
Using MapBusinessOnline Standard, a comprehensive market analysis is generated for a given area or the entire nation. A great starting point is importing current or recent sales location data by customer address. Importing Excel spreadsheets with addressing is quickly done in MapBusinessOnline Standard or Pro. Pro enables the import of up to 250,000 records per map. Standard users are limited to 50,000 data points per map.
What you use for sales activity depends on what other information you want to include in your map project. Imported data can be visualized as ZIP code thematic maps or displayed as color dots of various sizes. Heat map views that turn imported numeric data into what looks like a weather map can also be an effective way to display sales activity. Always keep in mind the KISS rule of business mapping:
KISS – Keep it Simple Stupid.
Read more about importing your location data spreadsheets here. Complicated or cluttered maps lead to distracted map viewers and confusing map messaging.
Cluttered or informative? The Map Creator decides.
Include Demographic Mapping
Market Analysis maps are usually about business potential and sales growth. Consequently, for many businesses, the next MapBusinessOnlone feature to consider is Demographic Mapping.
Both MapBusinessOnline Standard and Pro allow the map creator to access demographic information from the Census Bureau and add it to the map view as both a map layer theme and a database layer.
Choose your demographic categories carefully. It’s essential to connect the selected demographic layers with your business in some way. Population and income levels are popular categories, but they could be irrelevant for some business analyses.
Retail business analysis will include population segments such as kids, the elderly, or women aged 25 to 50, depending on the products sold. Hot tub manufacturers may be more interested in examining higher median house income levels in affluent ZIP codes or Cities. My point – keep the core business focus and product offering in mind when generating demographic analysis.
Demographic data can be leveraged in various ways within MapBusinessOnline market analysis. The map creator should consider the options, keeping her map audience’s critical business interests in mind.
- Which map layers would best demonstrate the most relevant demographic data? ZIP codes, City limits, or perhaps Counties?
- Are there additional map data sources that serve the map well if referenced numerically in labels?
- Or would an area Summary query added to the map add value for the map viewer?
With all of these options, think about your map audience’s perspective. Lay people may be overwhelmed with too much detail. A room full of MBA holders will want to see justification data.
Read more about labeling options here.
Map Layer Choices
The map creator should carefully consider which map layer best represents the business map’s ultimate goal. Do counties reflect your subject business better than Zip codes? Think it through. Perhaps your sales territories are based on ZIP codes. If that’s the case, then ZIPs are probably a better map layer for your analysis.
City limits are also a possible base map layer for your market analysis. If you are a retail chain with store placements at inner city locales, give the City Limits layer a try. I like City Limits for high median income level assessments. It’s a great way to filter by income levels to show the nation’s top twenty cities for your detailed analysis.
ZIP codes are better for identifying urban area demographic characteristics related to a product or service. Identify ZIP codes where sales and marketing efforts are performing well and gather vital demographic data related to your product or service for that ZIP code. Next, find similar ZIP codes in untapped parts of the nation.
Counties may be a better map layer for businesses selling in rural areas. Counties cover a broader scope of interest, gathering more consumer data for analysis.
I want to introduce one more beneficial tool for building market analysis – Calculated Data Columns. Calculated Data Columns are applied by the map layer. It allows the map creator to sum related demographic data layers into a single combination layer for use in Territories, ZIP code maps, and market analysis.
Use calculated Data Columns to sum similar demographic data segments. Examples include creating one calculated data column from:
- Various population segments by age into one Elderly Population layer.
- Disparate children population by age segments into one Kids Population segment.
- The highest four median income levels into one Wealthiest Americans segment.
The Wrap Up
My point is to demonstrate that MapBusinessOnline Pro and Standard offer multiple features that provide advanced market analysis for sales and marketing teams or strategic planning.
The advantages MapBusinessOnline Pro provides over Stanard include:
- Import up to 250,000 location points.
- The Analysis Tab
- Multiple Dataset Driving Time and Distance Queries.
- Proximity Searching.
- Batch Calculate Origin to Destination Pairs.
- Enrich and Summarize Imported Business Datasets with Demographic and Geographic Data.
- Create One-Pass Multiple Drive Time-based Territories.
Map creation and market analysis are natural partners in support of business planning. Take the time to explore some of MapBusinessOnline Standard and Pro features so that your business fully benefits from the power of location. Your company’s business trajectory and career path stand to gain from the exercise.
_______________________________________________
Discover why over 25,000 business users log into www.MapBusinessOnline.com for their business mapping software and advanced sales territory mapping solution. The best replacement for Microsoft MapPoint happens to be the most affordable.
To access MapBusinessOnline, please register and download the Map App from the website – https://www.mapbusinessonline.com/App-Download.aspx.
After installing the Map App, the MapBusinessOnline launch button will be in the Windows Start Menu or Mac Application folder. Find the MapBusinessOnline folder in the Start Menu scrollbar. Click the folder’s dropdown arrow and choose the MapBusinessOnline option.
The Map App includes the Map Viewer app for free non-subscriber map sharing.
Please read customer reviews or review us at Capterra or g2crowd.
Contact: Geoffrey Ives at geoffives@spatialteq.com or Jason Henderson at jhenderson@spatialteq.com