
One remarkable aspect of MapBusinessOnline and business mapping software, in general, is the array of options the map user can select to solve a business problem.
Business mapping software solves business problems associated with location data. Connecting business sales data with demographic and geographic data through map visualizations informs decision-making and encourages growth and efficiencies.
Our Distracted Lives
I understand that, to a first-time user, all these business mapping choices can feel overwhelming. Especially when coupled with the rest of our day. Let’s face it; humanity has beset itself with incessant tech demands for our attention and decisions – all day, every day:
- Changing passwords.
- Security codes sent to your phone.
- Spamming emails, you need to sort through and delete.
- Spamming phone calls.
- Subscription renewal reminders.
- Anti-virus warnings.
- Dell, HP, and Apple notifications.
- Microsoft Windows updates.
- Special offers.
- Political donation solicitations.
- Pharmacy prescription renewals.
- Credit card alerts.
- Bank transaction notifications.
- Software update reminders.
- Your Mom is calling for help finding her cable station.
- Social media notifications.
- Software you didn’t know you had notifications.
- Mother-in-law notifications.
- Birthday reminders.
- LinkedIn connection requests.
- Appointment reminders.
- And, my favorite, your mom called again because your dad is on the phone with some guy with an accent from the Internet who is demanding a credit card number to release Dad’s computer from prison.
The list goes on, and it’s maddening. Add to this Christmas time a national election, a pandemic, or a significant winter storm, and you might as well take the rest of the year off. Oh yeah, and let’s not forget what happens today whenever a 95-year-old celebrity kicks the bucket. Stop the presses! Circle the wagons! Alert the authorities! Betty White died of natural causes.
But I digress. Now, where was I?
MapBusinessOnline, despite all the interruptions, offers geographic and demographic solutions to business problems. Problems a map user may not even realize they have.
Sales Forecasting Presentations
Sales and marketing professionals are tasked with developing sales forecasts, often presenting and justifying these forecasts in a meeting with the executive team. Certainly, spreadsheets will be part of this process, but giving spreadsheets and numbers in a PowerPoint presentation to the executive team can be risky. Some of the team will be bored and distracted. Others will have trouble believing how the forecast rolls up into territories from individual salespeople.
The risk is if you leave them wondering whether or not the forecast is accurate, your future with the company is in doubt.
MapBusinessOnline sales territory management tools combine the power of spreadsheet columns and data summarizations with compelling map visualizations. Your spreadsheet probably lists each account with the previous year’s sales numbers. Imported as an address spreadsheet into MapBusinessOnline, this same sales data will sum by address and territory and roll up nicely into regions and divisions. MapBusinessOnline calls these hierarchical territories.
I suggest using MapBusinessOnline live or image slides within a sales forecast presentation. These on-map sales account forecasts can be arranged to show forecast vs. actual or previous years vs. current year. Territory areas can be color-coded to reflect progress against goals or comparisons to last year.
Client-by-client forecast records could be visualized as address points on the map with associated sales activity and projected numbers added to labels. Client location address datasets can be included in the forecasting map but turned off – there for reference and discussion if questions arise.
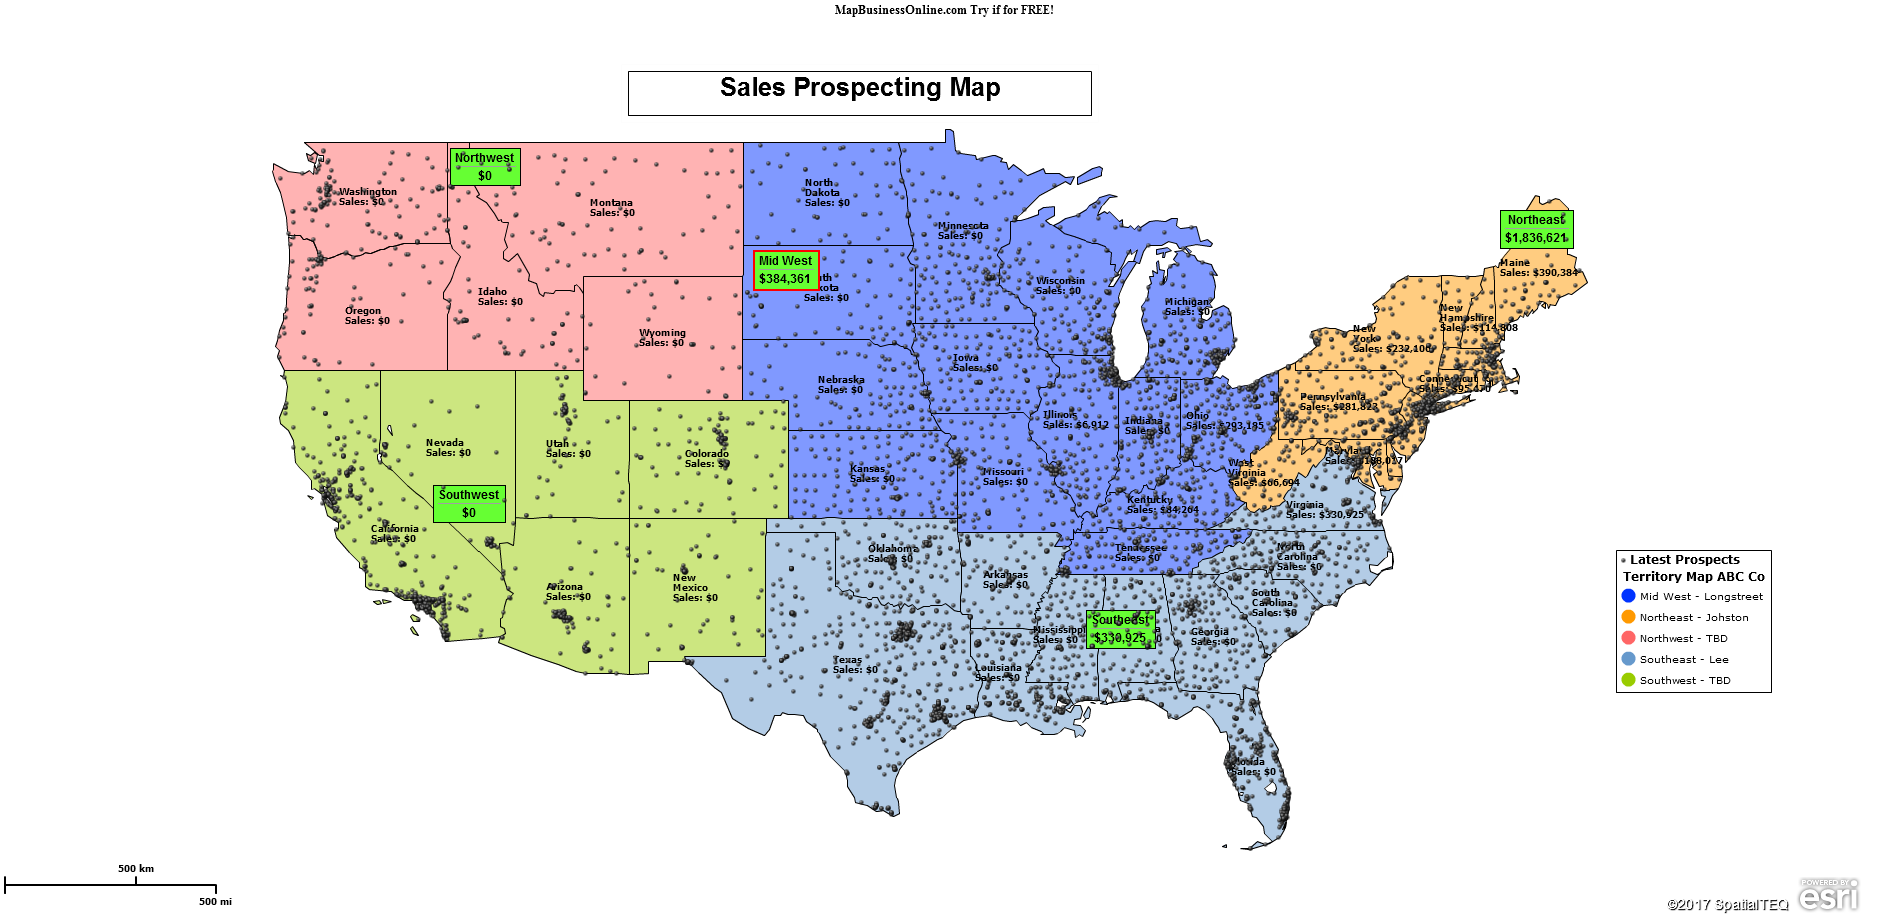
MapBusinessOnline Used to Create a Sales Forecast Map
In response to questions from the executive team, client details can be instantly turned on to reveal real numbers supporting the total forecast. No presentation can answer every question. But by presenting an organized map-based forecast with backup for projected numbers, you will have gained the confidence of your higher-ups and can always follow up later with more details. Remember: Follow-up completed shows you are reliable.
A powerful element of business mapping software stems from the fact that humans have an affinity for maps. A well-crafted business map quickly informs the map audience. Combined with accurate spreadsheets, business maps instill a sense of trust and professionalism in any presentation of location data. And if you are associated with a solid presentation, that bodes well for your future.
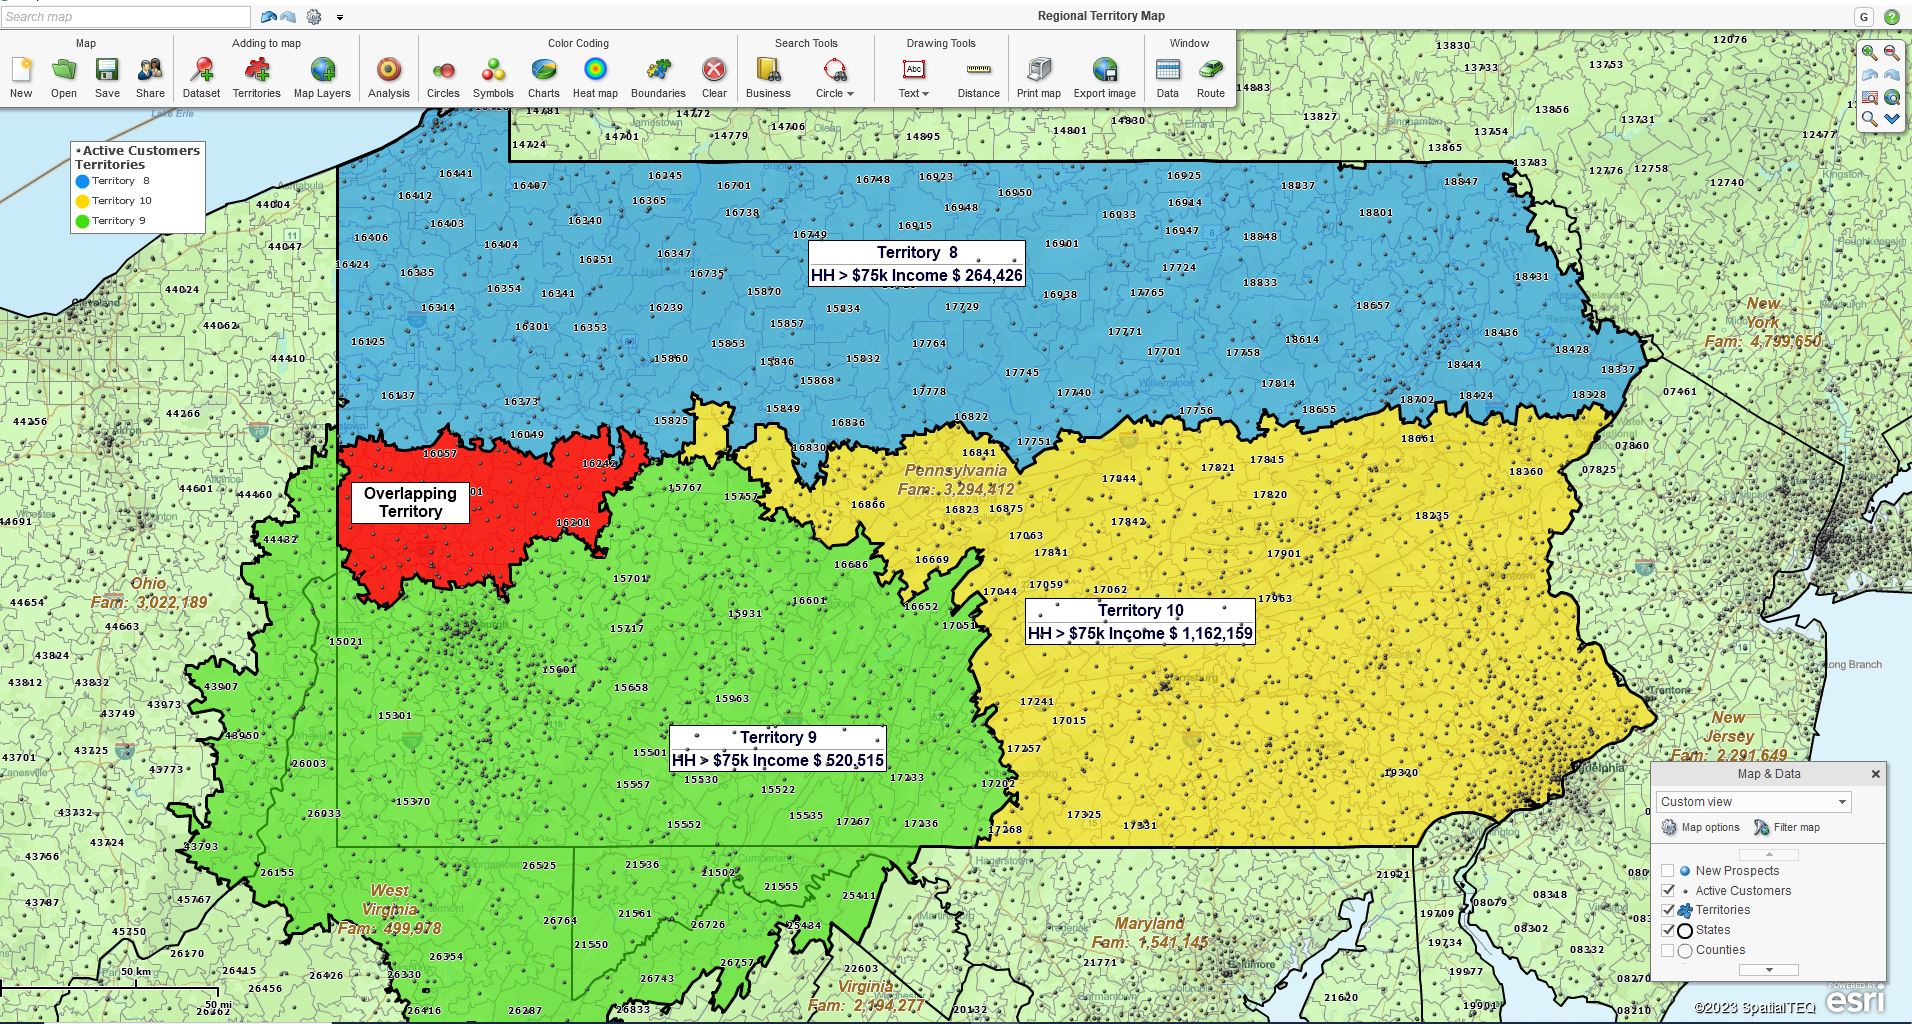
Using a Sales Territory Map for a Presentation.
Segmenting Marketing Lists
In MapBusinessOnline, when you import a list of customer addresses, those ‘points’ appear on the map, ripe for color-coding and symbolizing. But those imported numbers appear in tabular or spreadsheet format in the Data Window view.
The Data Window view of your imported data is called a Marketing List by MapBusinessOnline. Within the Data Window view, you can filter any marketing list in various ways to accommodate business activities or analyses. You could, for instance:
- Move the extent of the Data Window itself to contain your preferred segment of the entire list, and then save that segmented view as a new Marketing List for analysis, routing, or export.
- Cursor-select a section of the list which will then highlight in yellow. Once again, save the list for other operations.
- Filter the list by any column of data using the Funnel filter icon on the Data Window toolbar. Example filters might be to find all filtered records in this set of ZIP codes, filter all records with a population greater than X, or perhaps filter for all territory names that include the letters ‘ton.’
In the map view, you can also apply spatial filtering or queries to marketing lists. For instance, you could:
- Filter a whole imported dataset by applying a Radius, Polygon, or Drive Time search. Save the data results as a new marketing list.
- Filter imported business listings datasets by ZIP code, city limit, county, or territory. Once again, save it as a marketing list.
- Look to the Map and Data box to filter the data visually by State.
Marketing lists are filterable. This makes segmented business operations possible. So instead of routing on all points, you can route on a segmented group of points selected based on filter criteria. Your travel routes could be developed based on proximity to a sales representative’s home address.
At any rate, filtering and data segmentation help you solve problems in multiple situations:
- Analysis – Limit your map view to certain areas. Conduct ZIP code – to ZIP code analysis. For instance, filter marketing lists by ZIP code and then apply demographic categories to your analysis.
- Routing – Route your technicians, salespeople, or clinicians to segmented lists of contacts by address – up to 150 stops per route. Just click the Add to Route button on the Data Window toolbar.
- Logistics – Conduct batch calculations across 1,000 origin points vs. 1,000 destination points. Estimate travel times, distances, and expenses. Conduct ZIP code – to ZIP code analysis.
MapBusinessOnline – solving problems you didn’t realize you had.
Adding Demographic or Geographic Data to a Spreadsheet
Until the boss asked you for this information, you didn’t think you had this problem. She’s got a spreadsheet with your vendor addresses on it, but the vendor needs the ZIP codes and recently associated population totals added to the data.
Using MapBusinessOnline Pro, you can import location data into a Data Window view and use the Enrich a Dataset option under Analysis on the Master Toolbar to supplement that data with demographic or geographic categories. Export to CSV for use outside of the application.
This particular problem doesn’t happen every day. But when it does, the Enrich a Dataset tool is an easy way to get at geographic and demographic data in one pass.
The above examples are just a few business problems MapBusinessOnline can help solve. Unfortunately, we haven’t figured out how to keep grandparents off the Internet. My dad did well with computers in his twilight years until he watered his laptop. They dry out so quickly, you know.
_______________________________________________
Discover why over 25,000 business users log into www.MapBusinessOnline.com for their business mapping software and advanced sales territory mapping solution. The best replacement for Microsoft MapPoint happens to be the most affordable.
To access MapBusinessOnline, please register and download the Map App from the website – https://www.mapbusinessonline.com/App-Download.aspx.
After installing the Map App, the MapBusinessOnline launch button will be in the Windows Start Menu or Mac Application folder. Find the MapBusinessOnline folder in the Start Menu scrollbar. Click the folder’s dropdown arrow and choose the MapBusinessOnline option.
The Map App includes the Map Viewer app for free non-subscriber map sharing.
Please read customer reviews or review us at Capterra or g2crowd.
Contact: Geoffrey Ives at geoffives@spatialteq.com or Jason Henderson at jhenderson@spatialteq.com.