Over the summer, MapBusinessOnline image file export options were enhanced to include KML support. In addition to exporting images such as PNG, Jpeg, or PDF files, MapBusinessOnline now supports KML files.
Keyhole Markup Language (KML) is an XML-based file format that enables the transfer of geographic features to third-party software such as ArcGIS Earth, Google My Maps, and Google Earth. KML allows the MapBusinessOnline user to draw points, lines, and polygons on business maps and share those drawing overlays with other mapping users outside the MapBusinessOnline universe.
Put another way, map drawings and territories created in MapBusinessOnline, exported in KML format, can be imported and overlayed in third-party mapping software that supports KML use in the field. Additionally, traveling field staff can access shared territory maps as KML files and quickly import them into mobile devices for display over Google MyMaps or other mobile map apps.
Currently, standard maps created in MapBusinessOnline are not supported on a mobile phone application. However, a map creator using MapBusinessOnline can create multi-colored territories or drawings showing highlighted and color-shaded areas and export those drawn figures as a KML file. Those KML files can then be imported into third-party desktop and web-based applications and apps supporting maps on a cell phone.
KML Support for Territory Map Views
How could KML Map image export come in handy?
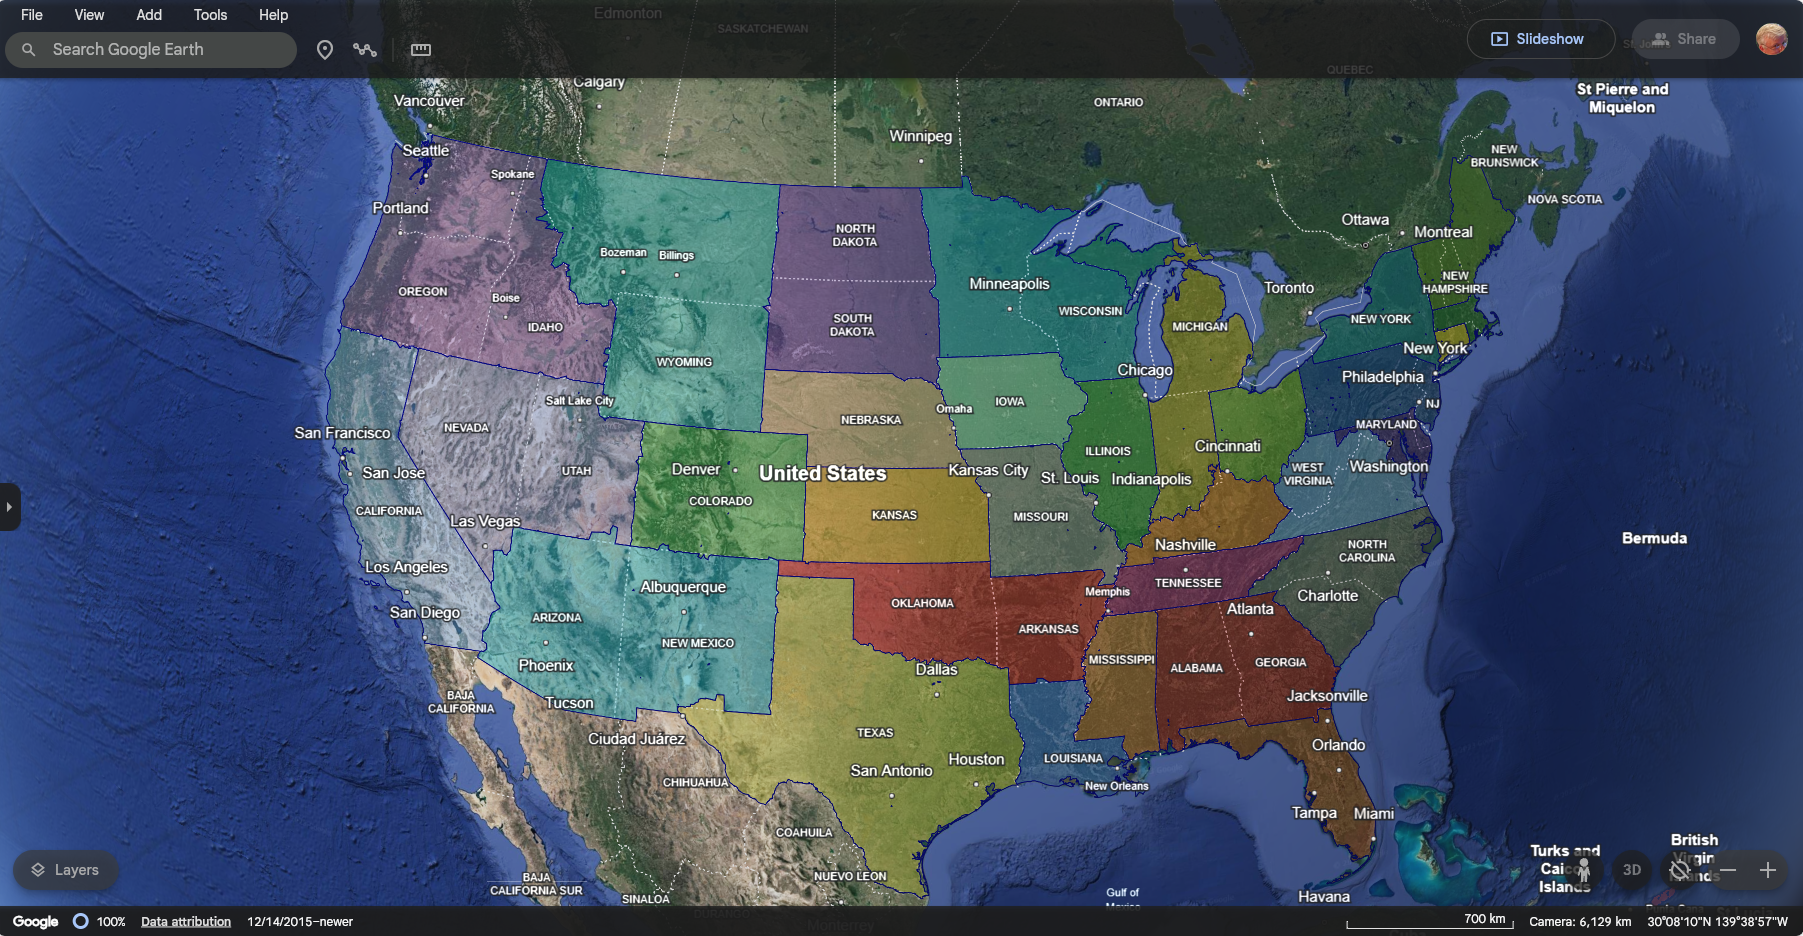
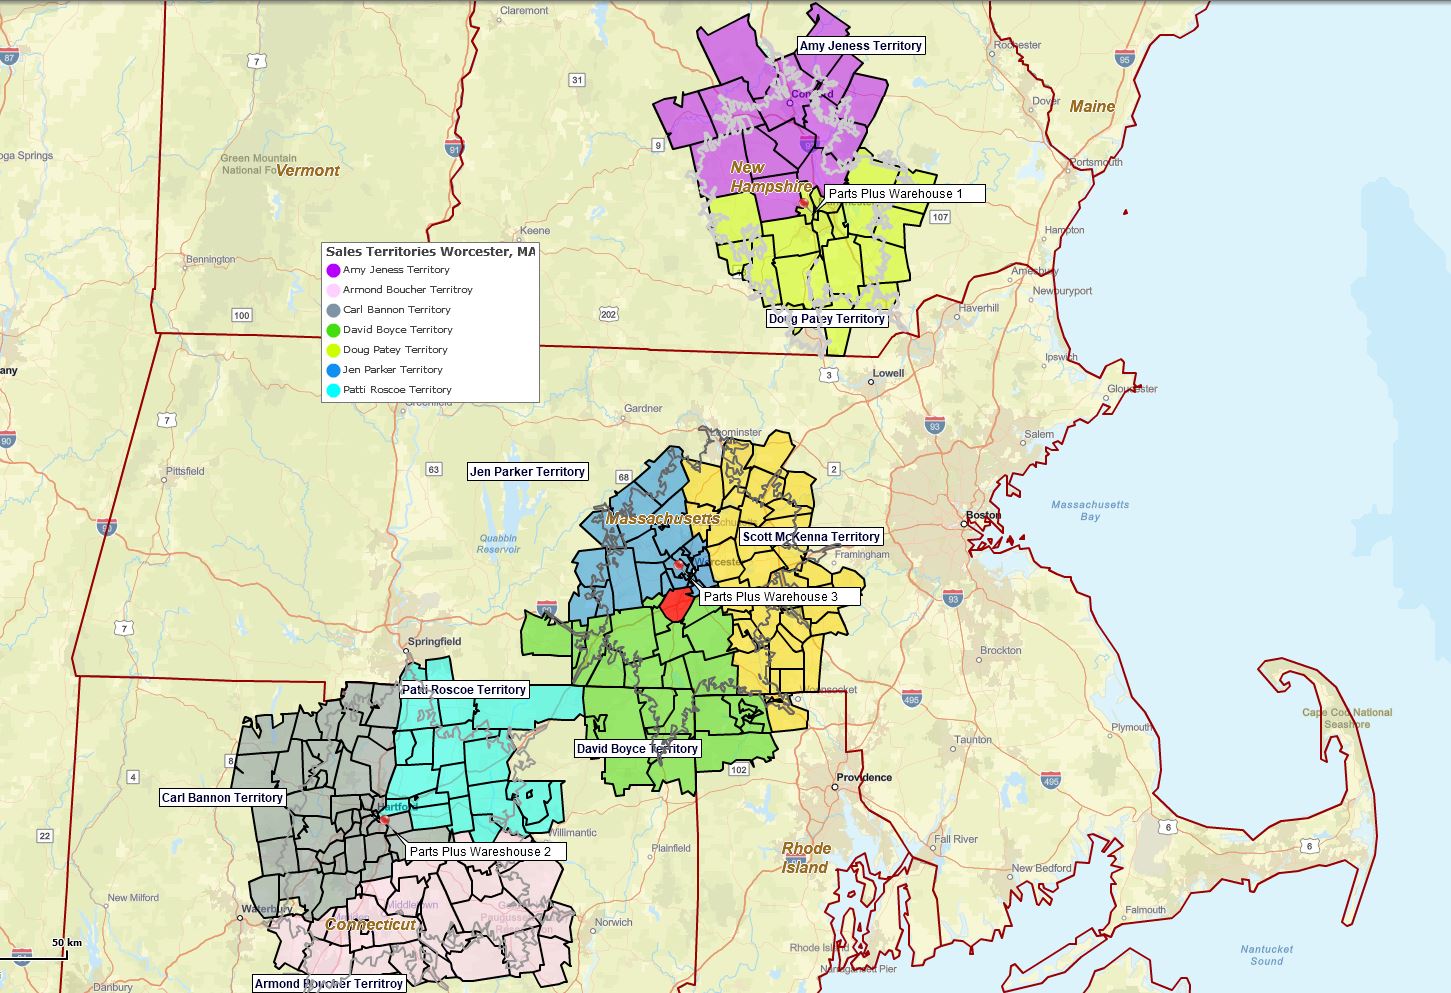
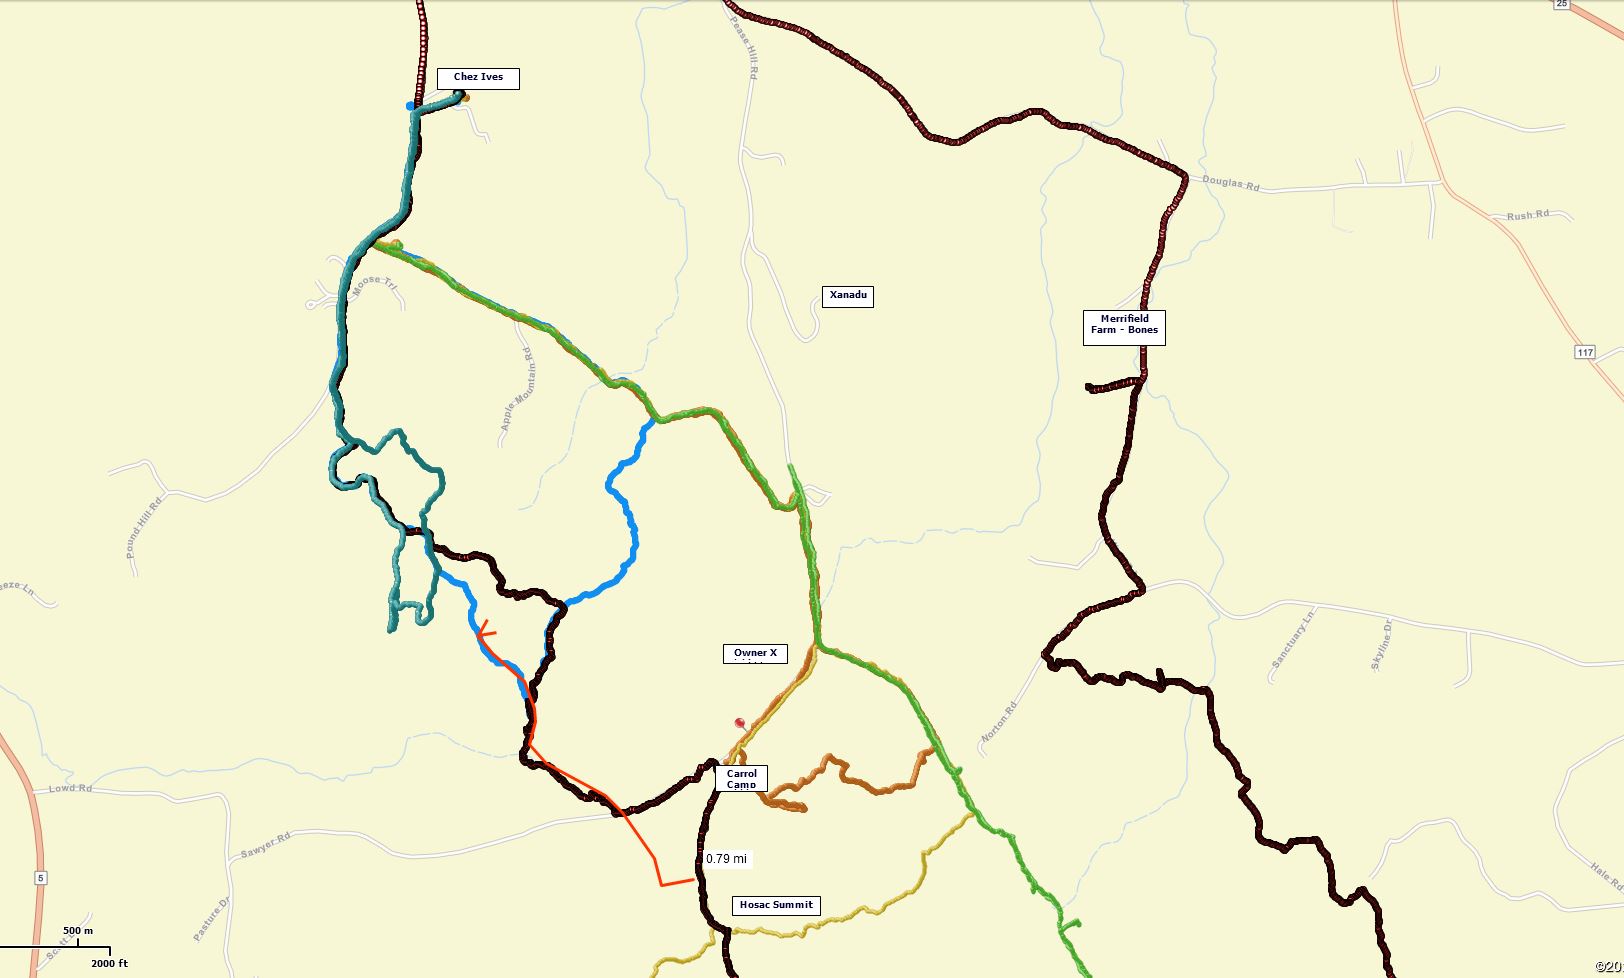
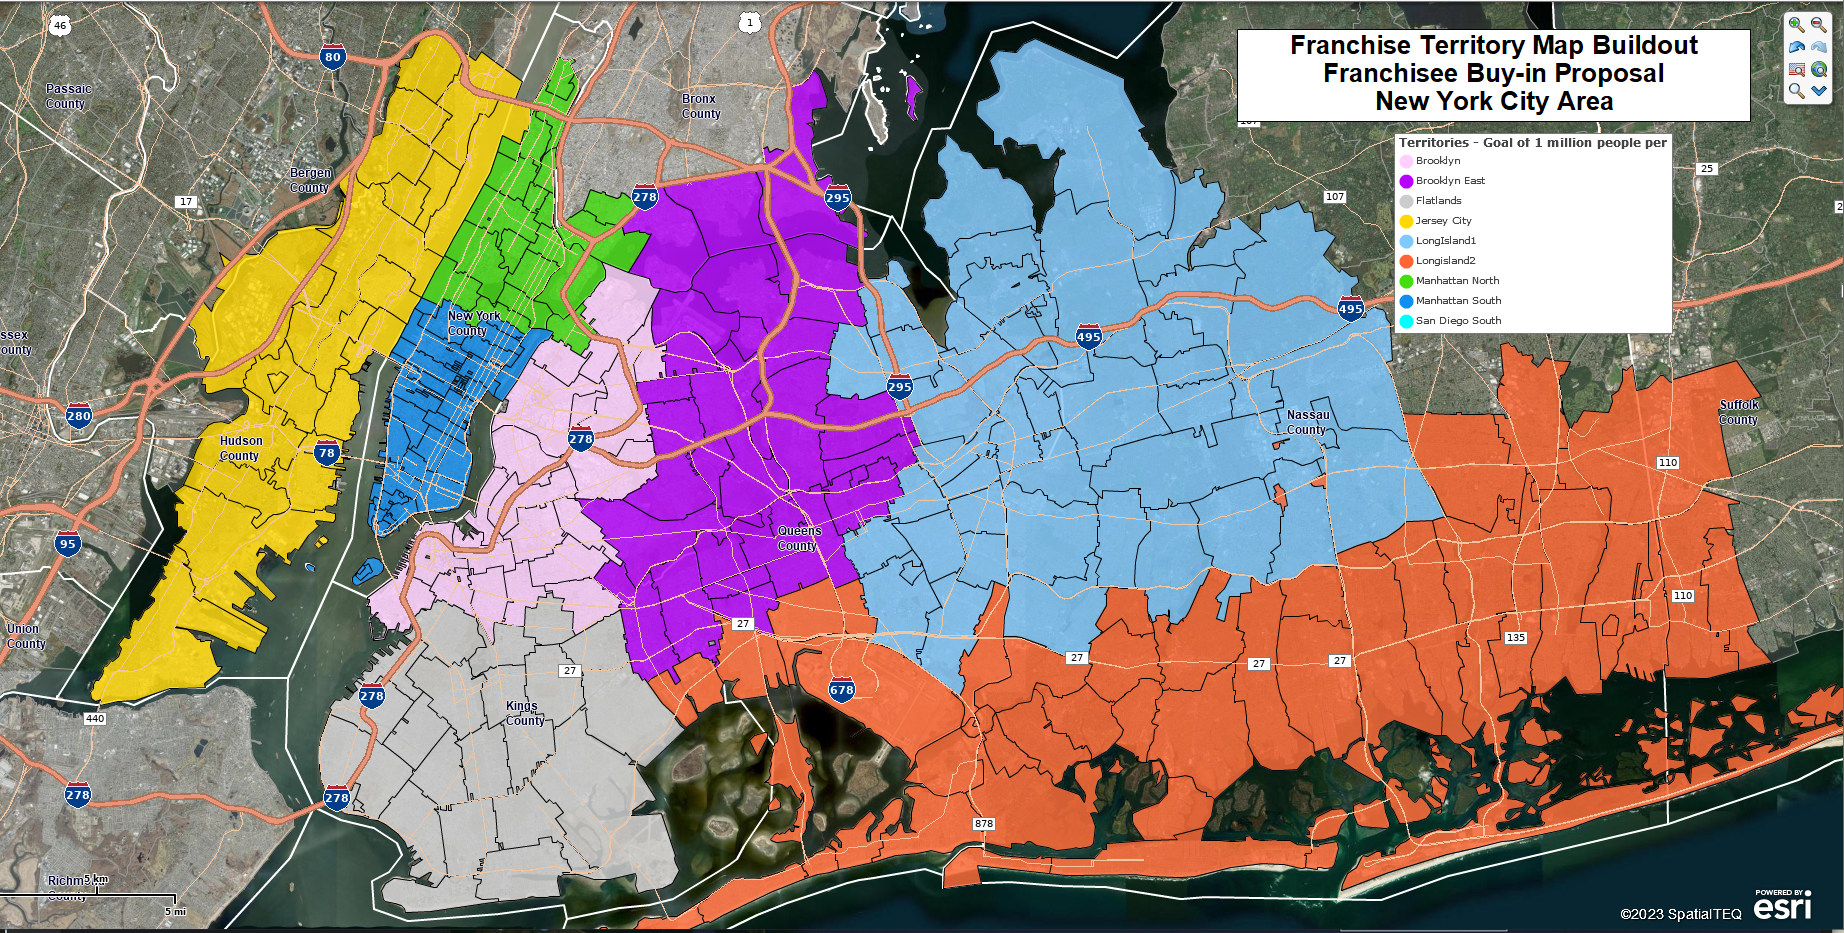
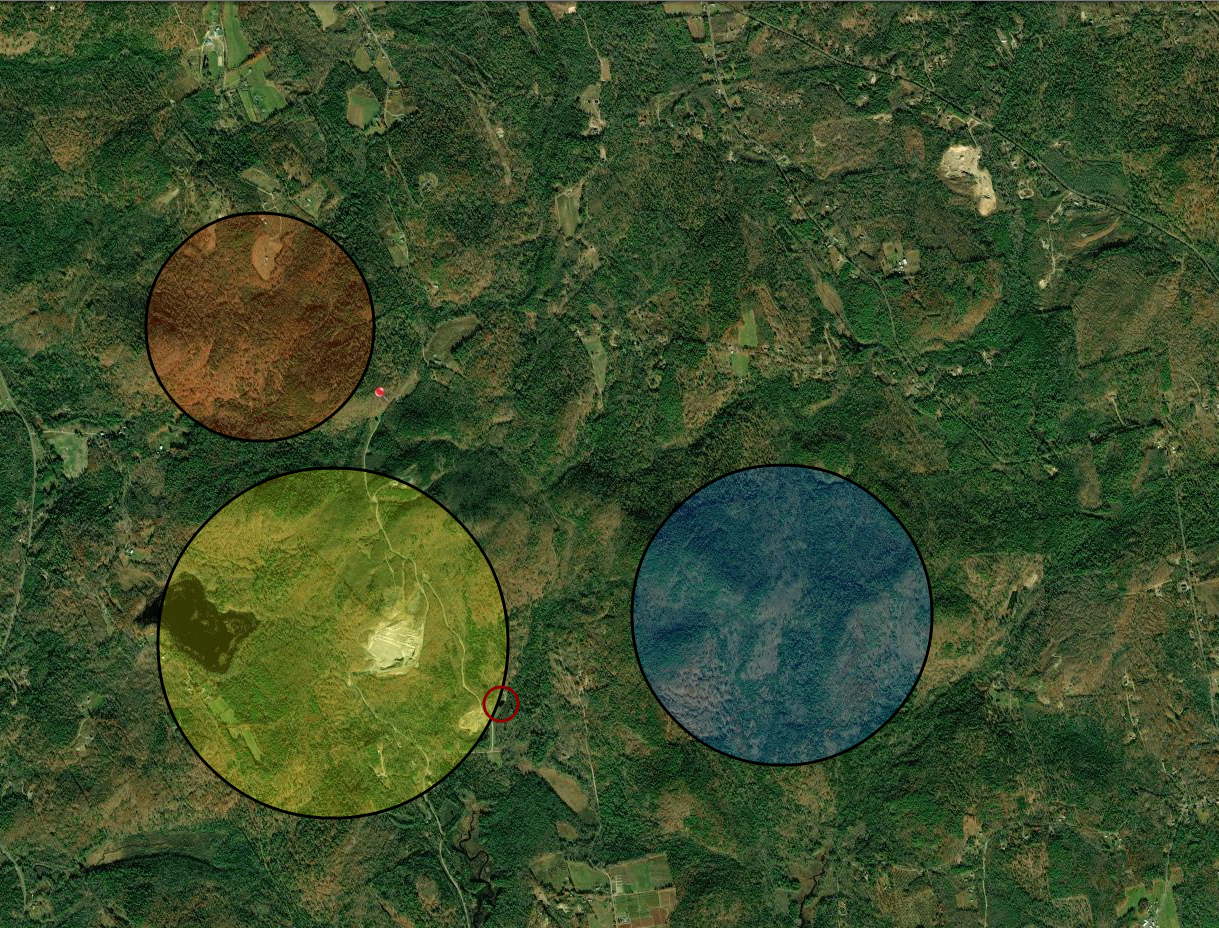
MapBusinessOnline generated territory scheme imported as a KML file into a Google Earth map project.
Companies that create sales, franchise, or service territories using MapBusinessOnline have multiple reasons for viewing territory maps on third-party web or mobile mapping applications, including:
- Sharing territory map views and areas of responsibility with field technicians, sales reps, or franchisee employees.
- Executive or management map views supporting sales planning, strategic planning, and general management decision-making. Think CFO with a laptop on a plane.
- General geographic referencing for customer service representatives to confirm customer locations and match customers with field tech territory assignments.
- Field routing applications in construction and insurance can benefit from awareness of proximity to territories when approaching job sites.
These are just a few examples of KML territory applications we know. There are many more possible applications for business mapping KML support.
In any of the above scenarios, a territory manager can easily export a KML file out of MapBusinessOnline and import the file into a KML-supporting application. The exported territories would appear on the map view draped over the original map.
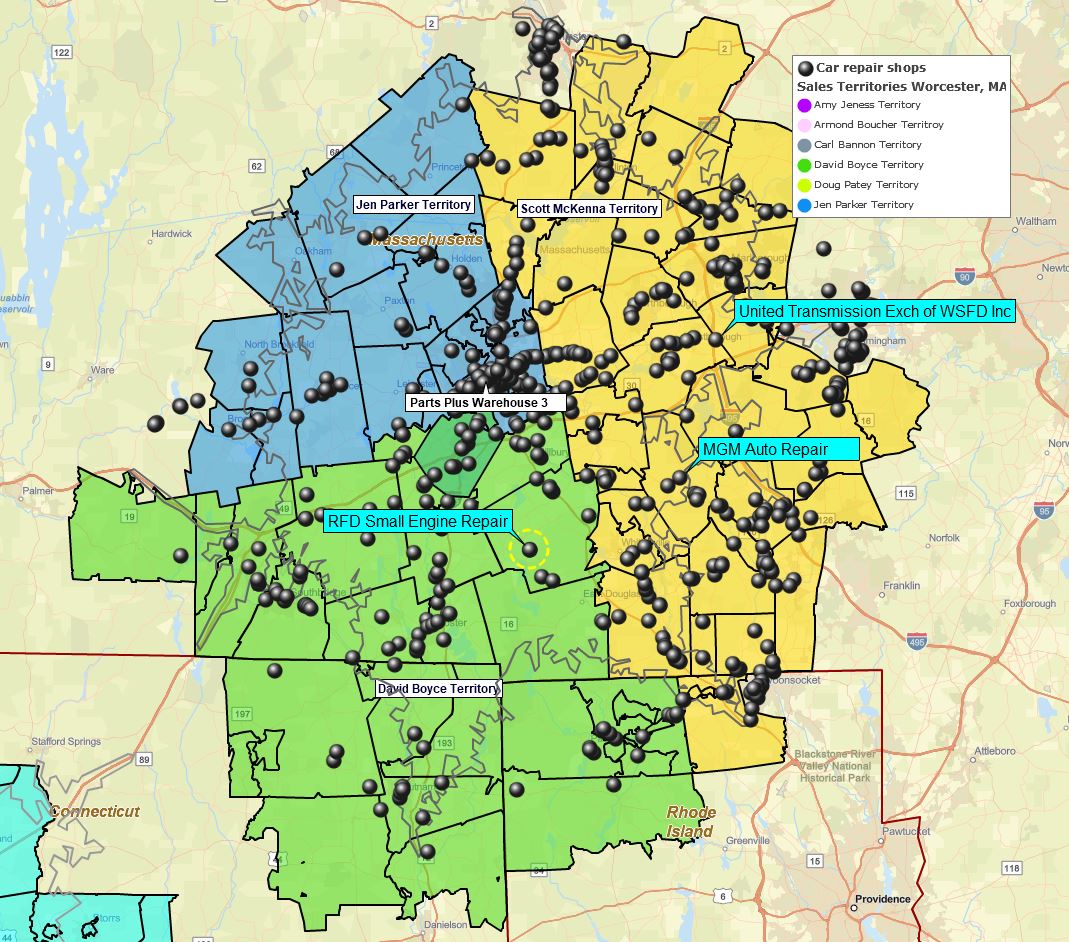
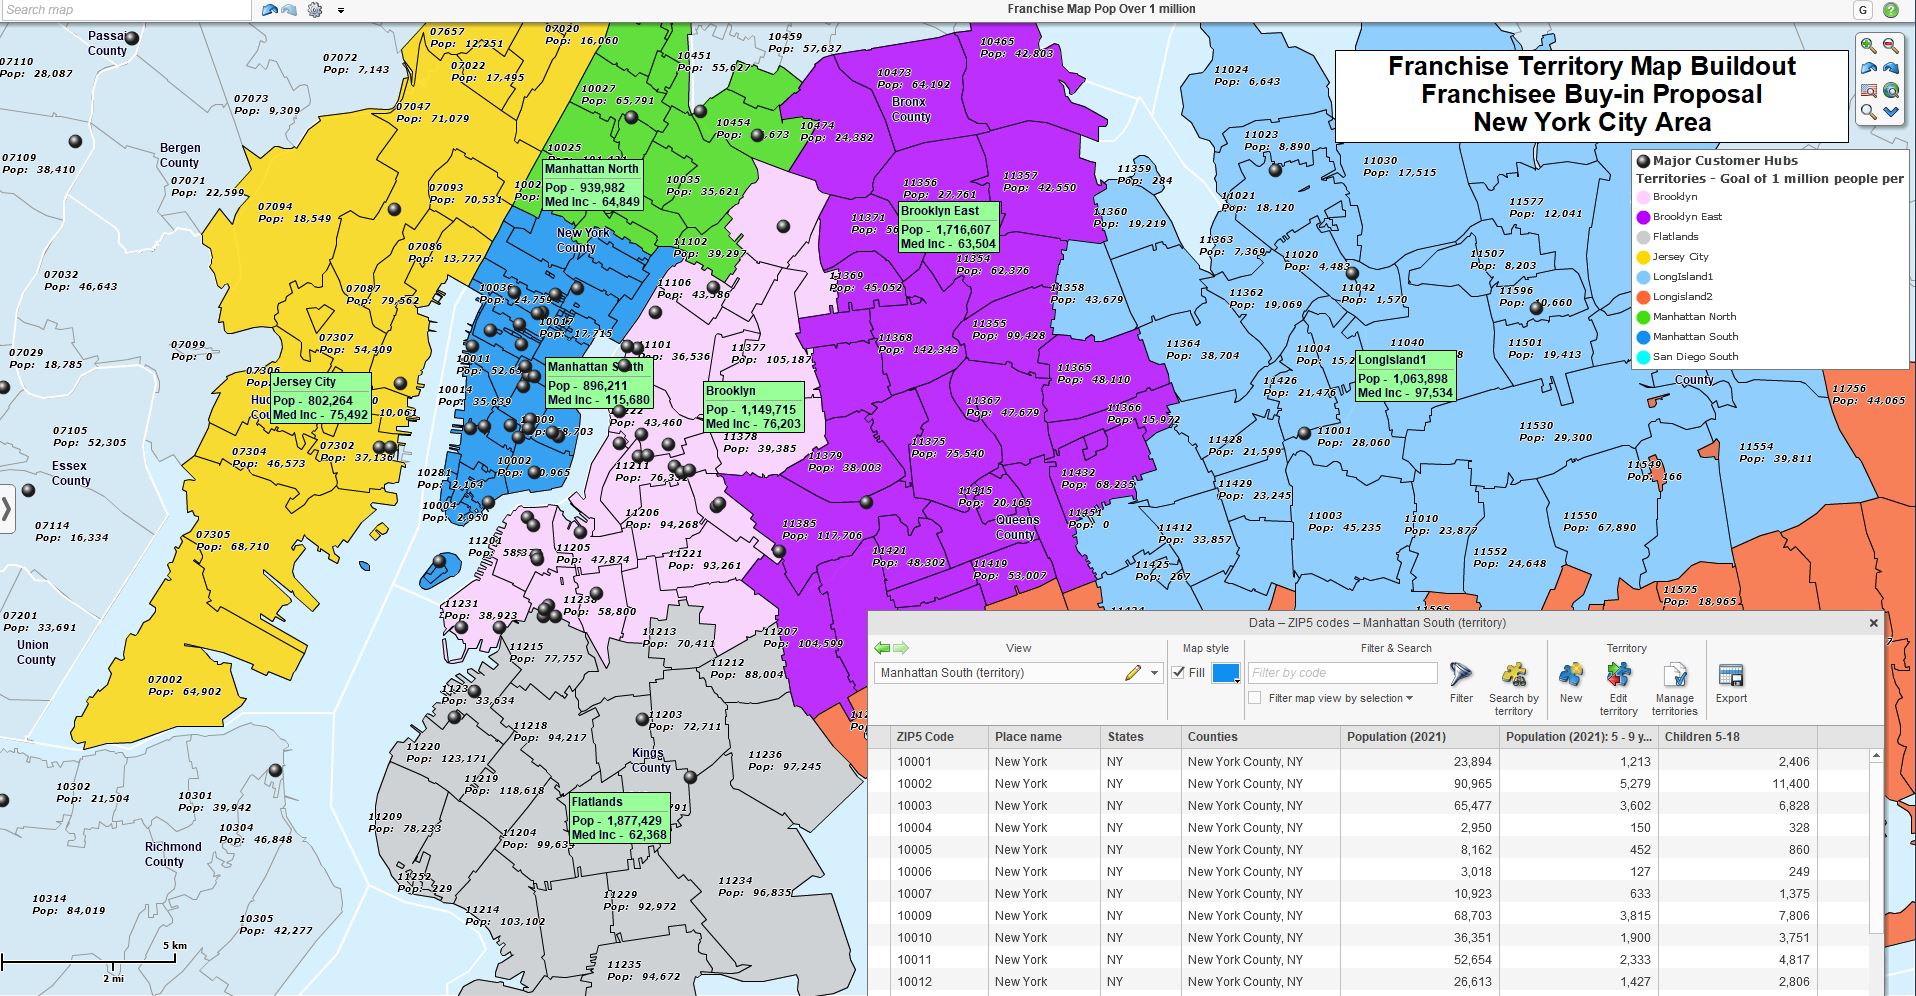
A franchise territory map in MapBusinessOnline above, exported to Google Earth below.

The process for moving KML files from MapBusinessOnline to other KML applications is outlined below:
- Export the territory or draw layers from MapBusinessOnline by clicking the Export Map Image button on the Master Toolbar.
- Select the KML Territories or Drawings option in the Map Image dropdown.
- Select KML or KMZ file format and export.
- Import the data via the standard drawings or image file import process within the target application (Google Earth, Google My Maps, ArcGIS Earth, or other applications). Applications usually specify KML import options.
The process for importing KML files into the Google Earth web application is also simple:
- Log into Earth.Google.com.
- In the Google Earth Dashboard view, choose File in the upper left dropdown and select Import KML/KMZ file.
- Select your file and click Open.
- Google Earth zooms into your area of interest and displays your images or drawings.
For Google Earth mobile phone KML import:
- Drag the bar at the bottom of the app window up. KML import is on the right.
- Click the Plus sign (+), select Local KML, and then Import.
- Navigate to your local file and select it.
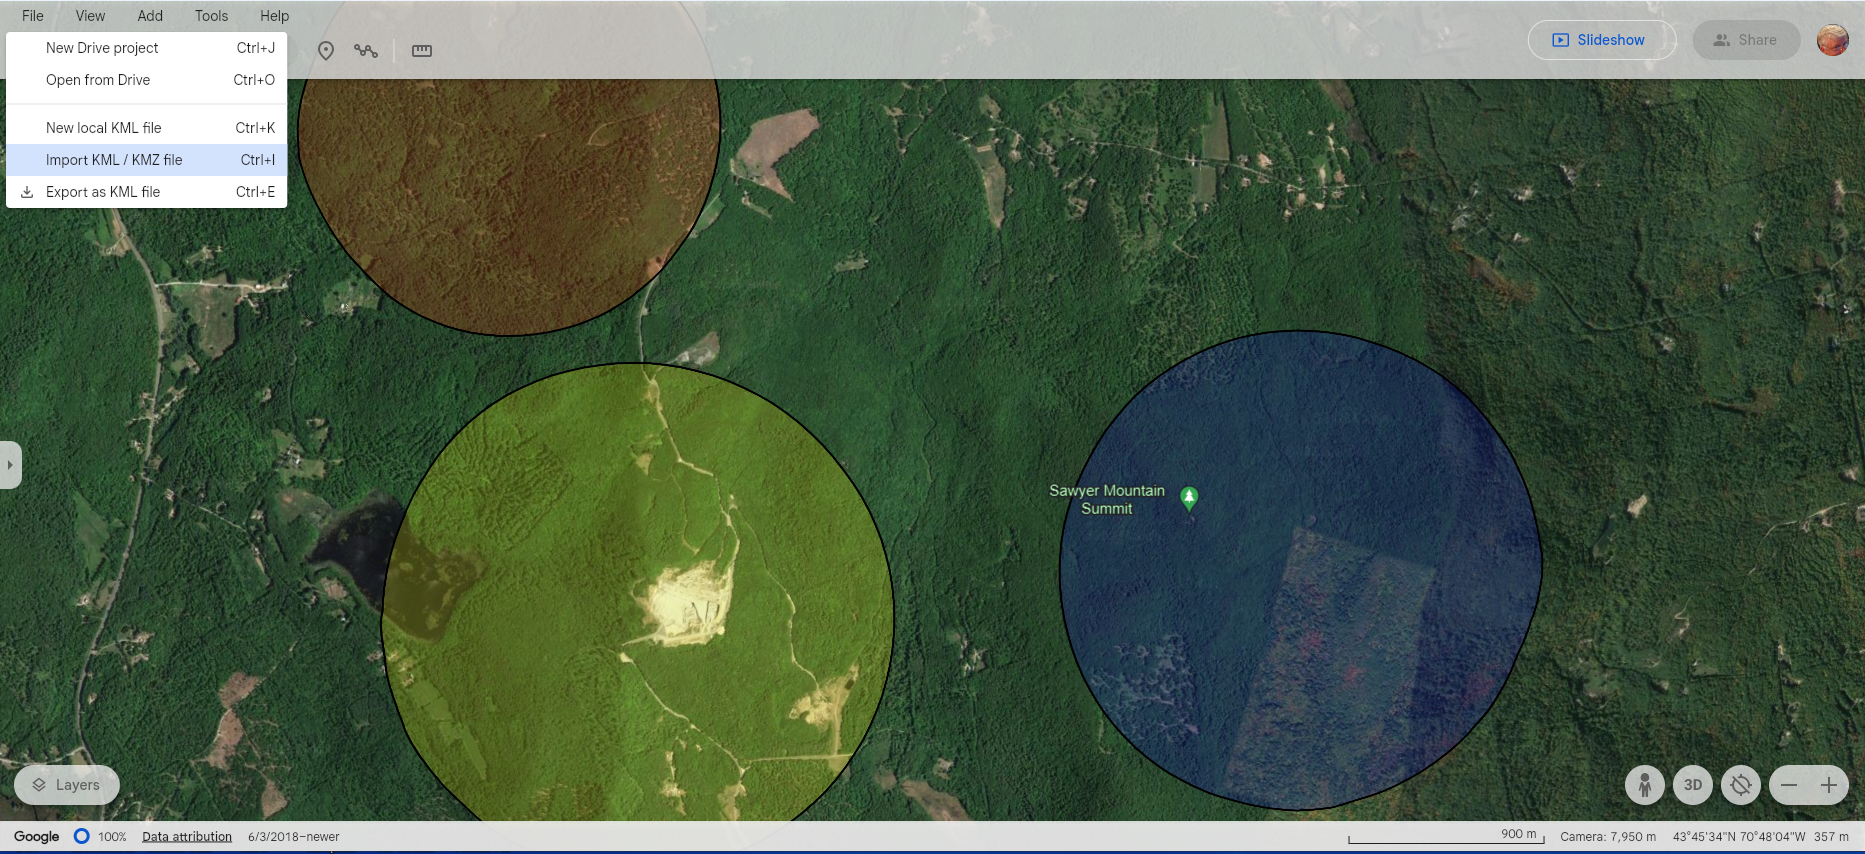
The Google Earth web-based dashboard, with the KML import button highlighted on the left.
Another Google web-based solution is Google My Maps, not to be confused with Google Maps.
- Go to Google.MyMaps.
- Select Create New Map.
- An Untitled dialogue opens in the upper left corner. Scroll down and click Import.
- Navigate to your KML data and select your target.
- My Maps does not zoom to the imported KML area; you will have to use the navigation zoom controls in the lower right of the app to zoom into your area of interest.
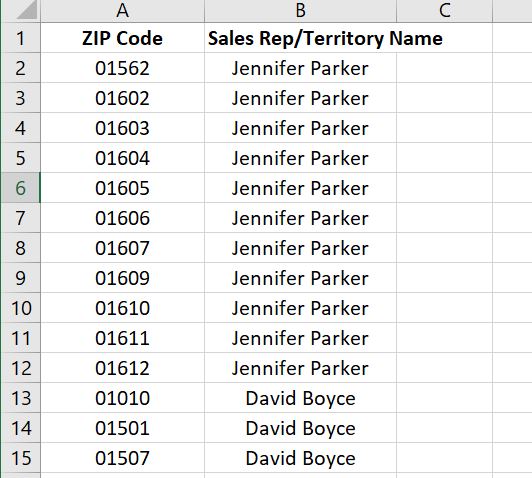
One nice feature in My Maps is that MapBusinessOnline territories appear in a map legend as clickable links. Clicking on the Territory name pops up a label and highlights the territory map’s alignment layer internal boundaries – ZIP codes in the case below.
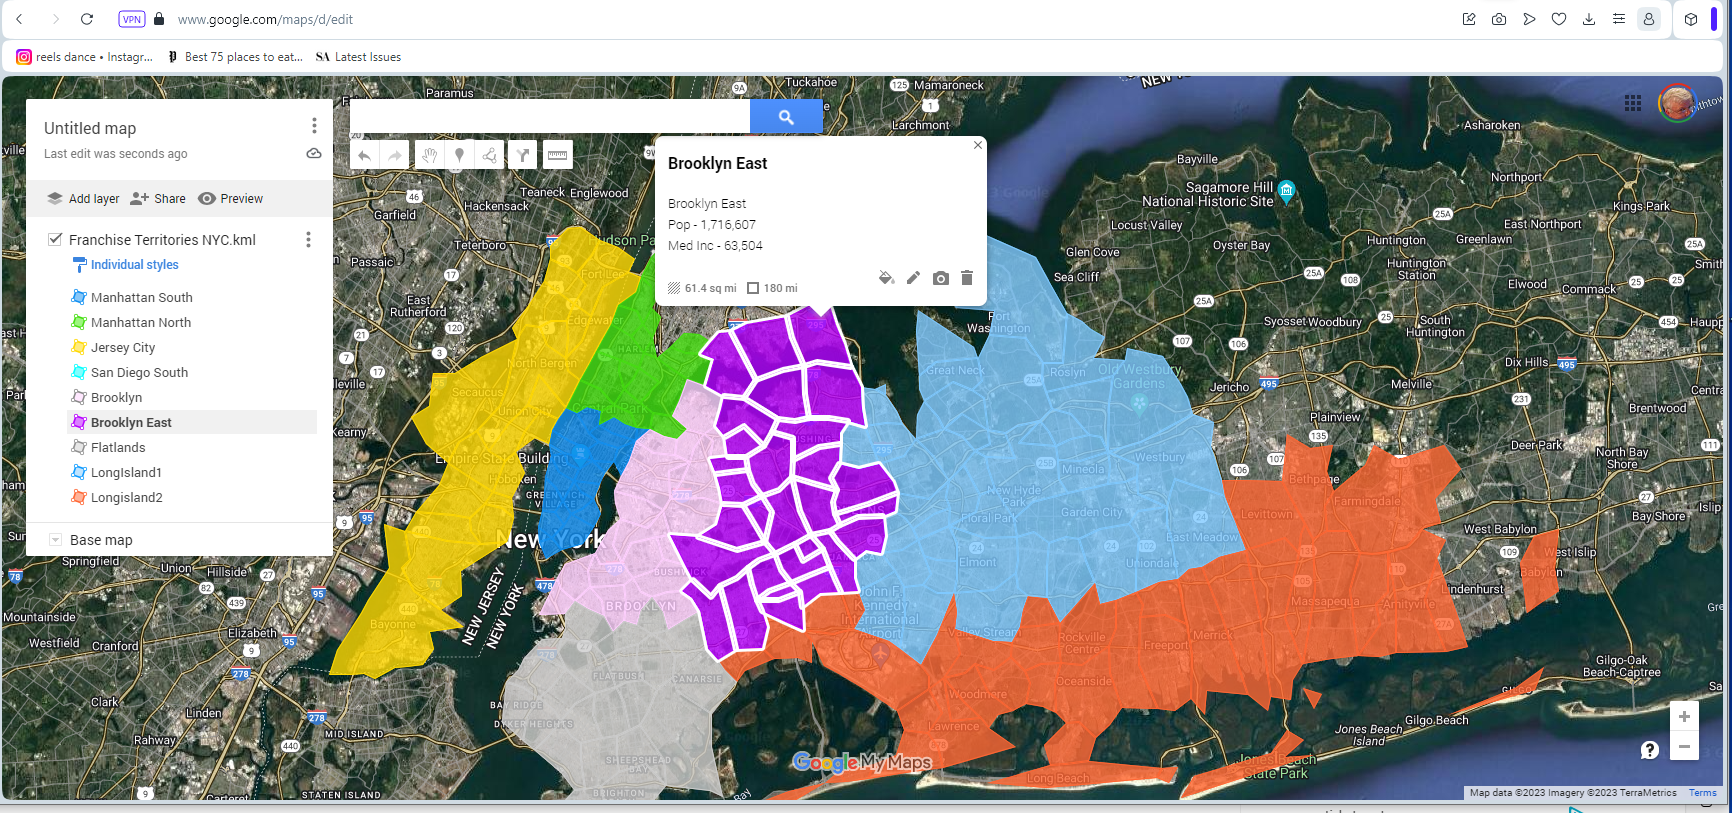
A MapBusinessOnline territory KML file viewed in Google My Maps with internal boundaries selected.
Both Google Earth and My Maps offer a selection of background maps.
ArcGIS Earth & Mobile Phone KML Overlays
Another example of a business needing KML support is a busy organization with just one or two GIS professionals managing all map requirements using GIS tools. It’s common for such busy GIS pros to get overwhelmed with map requirements.
In such cases, an end user might require a territory map exported to an application like ArcGIS Earth on a cell phone for visual reference. MapBusinessOnline can provide the KML capability to make that possible. ArcGIS offers both desktop and mobile phone versions.
The exported KML file can be imported into cell phone mapping applications that support KML. That exported KML image is then geolocated onto the cell phone’s digital world map at the appropriate location. Thus, a map creator can generate cell phone map views with MapBusinessOnline’s advanced map visualization layers included.
To import a KML file into ArcGIS Earth:
- Launch the ArcGIS Earth application.
- Along the toolbar in the upper left of the application, click the Plus sign (+) and select the Add Files Option.
- Navigate to your target KML file, select it, and click Open.
- ArcGIS Earth zooms into your area of interest and displays your image or drawings.
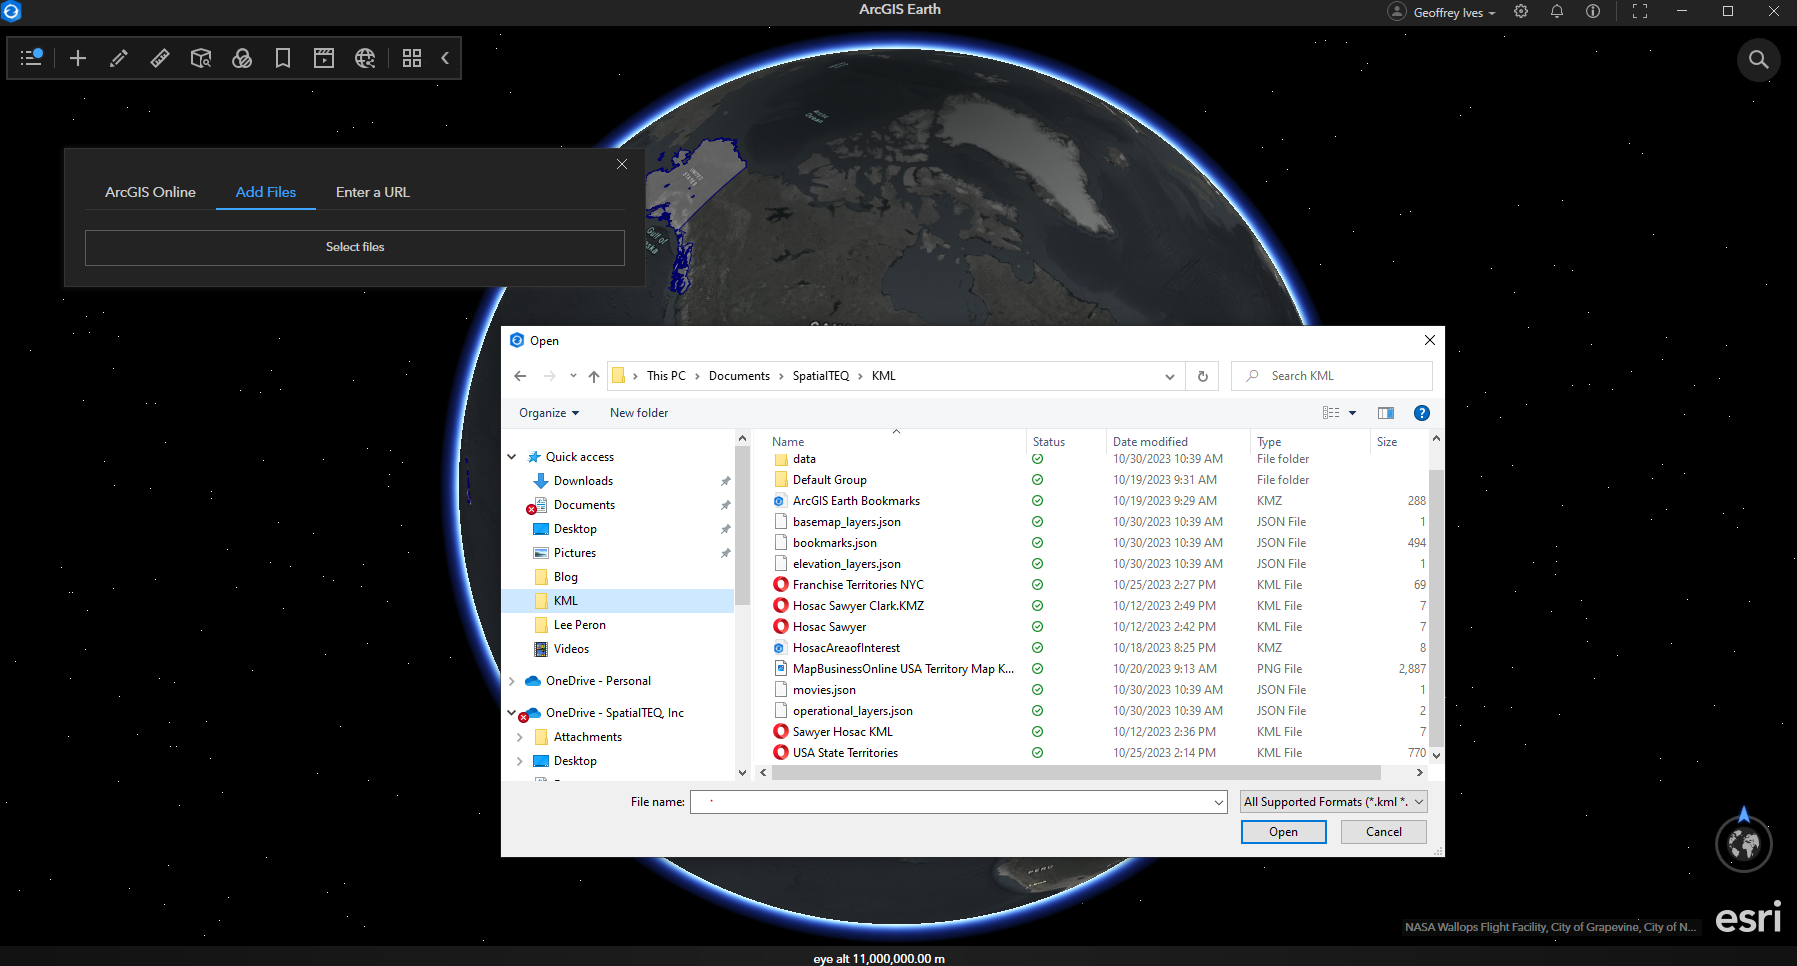
ArcGIS Earth dashboard and the import pathway for loading a KML file.
The above pictures show MapBusinessOnline-generated KML images imported over ArcGIS Earth Mobile in an iOS phone view. A map user routing in the field can find themselves accurately located within the critical areas of interest. ArcGIS Earth Mobile or other apps unrelated to MapBusinessOnline might be used to collect data in the field.
ArcGIS Earth offers excellent background map options, including multiple topography views and recent USDA NAIP imagery.
KML Conclusion
If constituents ask for a few drawn map objects or territory layers to be shared with a user on a cell phone or in a specific map application, help them decide which KML-supporting map application best fits their need.
- Google Earth for easy Import, auto-zoom, annotation options, and KML mobile phone map views.
- Google My Maps for labeling. My Maps does support KML mobile phone map views.
- ArcGIS Earth for the broad selection of background imagery. ArcGIS Earth Google Earth does support iOS phones with KML map views but not Android.
Then, send those field techs a KML file generated in MapBusinessOnline.