Service Territory Mapping Using MapBusinessOnline

MapBusinessOnline Service Territory Mapping provides all the tools necessary to design and maintain territories supporting businesses that provide services to their customer base instead of products. Service territories can be generated by ZIP code, county, state, or city limit. Territories can be created incrementally, one ZIP code at a time, using your mouse cursor or imported from thoughtfully designed territory spreadsheets.

Business mapping software generally includes territory mapping for sales organizations, franchise businesses, and service organizations. MapBusinessOnline Service Territory mapping tools organize and optimize travel activity for traveling technicians in service businesses. Service businesses turn to service territory mapping to:

  • Reduce travel expenses.
  • Balance workloads across the field tech team.
  • Minimize inefficient crisscrossing travel routes.
  • Improve service delivery on timeliness.
  • Monitor travel and expense records.

Small and large service organizations use MapBusinessOnline territory tools to:

  • Define and share service coverage areas by county, city limit, or ZIP code.
  • Monitor field technician territories to keep workloads balanced and to maintain customer satisfaction.
  • Develop drive-time-based territories with delivery zones for timely arrivals and competitive pricing.
  • Support field staff with optimized routing, informative map visualizations, and shared service territory maps.
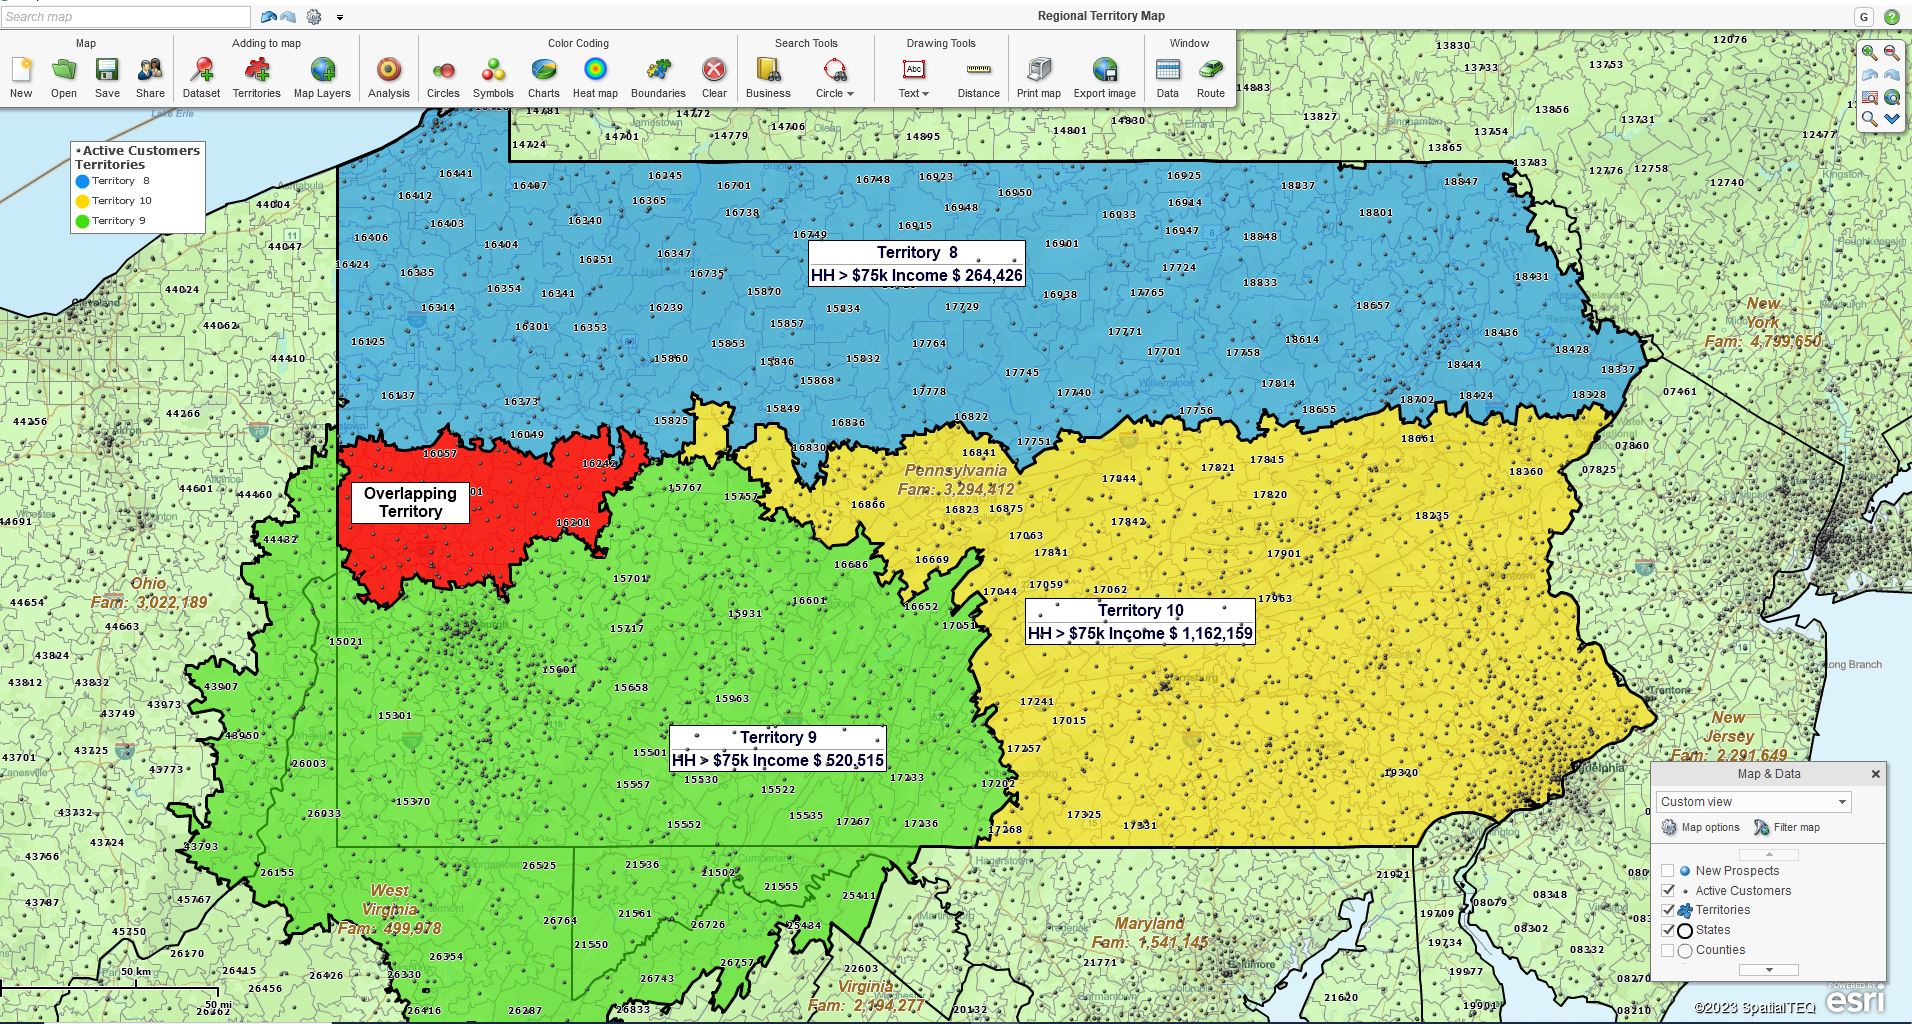
  • Control overlapping territories as required by the specific business realities.
  • Coordinate service location-based analysis with scheduling and accounting software.

Supports Various Service-Related Industries

Not all service industries are made the same. MapBusinessOnline service territory management tools support organizations across a variety of industries, including:

  • Rental agencies – Rental agencies require territory management software to help monitor national assets.
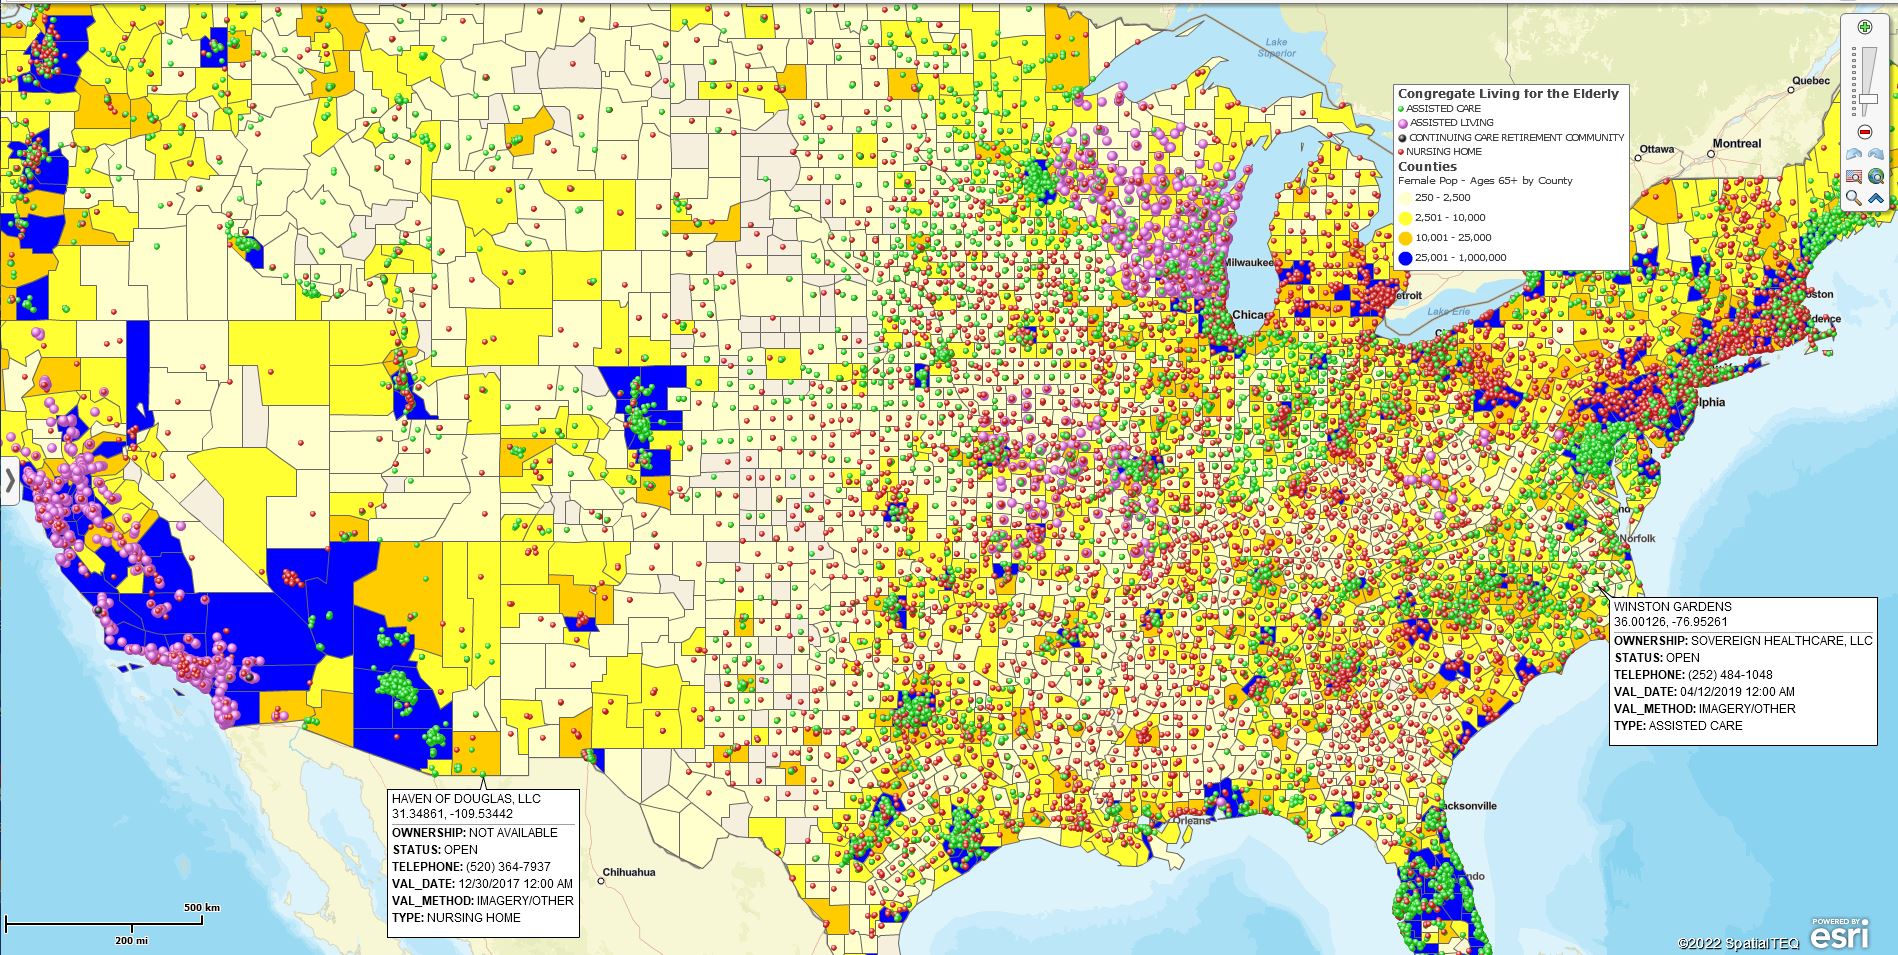
  • Home healthcare businesses – Territory services maps help this unique and growing industry of dedicated professionals serving aging Americans, disabled citizens, and other home-based people with limited abilities with efficient vehicle routing, minimizing travel expenses and improving efficiencies.
  • Insurance companies – Field technicians, inspectors, and claims adjusters investigating routine and disaster-related insurance issues.
  • Tech Organizations – Field repair technicians provide services to devise customers across the United States and Canada.
  • Local service providers – You name it – lawn and garden, swimming pool upkeep, floor coverings, roofers, carpenters, and a host of other businesses providing in-home services.
  • Large Retailers – Large retailers and retail chains use territory management tools to monitor and optimize store inventories, sales campaigns, and other business processes associated with significant investments in inventory.
  • Small niche businesses – New businesses offering tutoring, dog walking, nanny services, and delivery services are popping up.

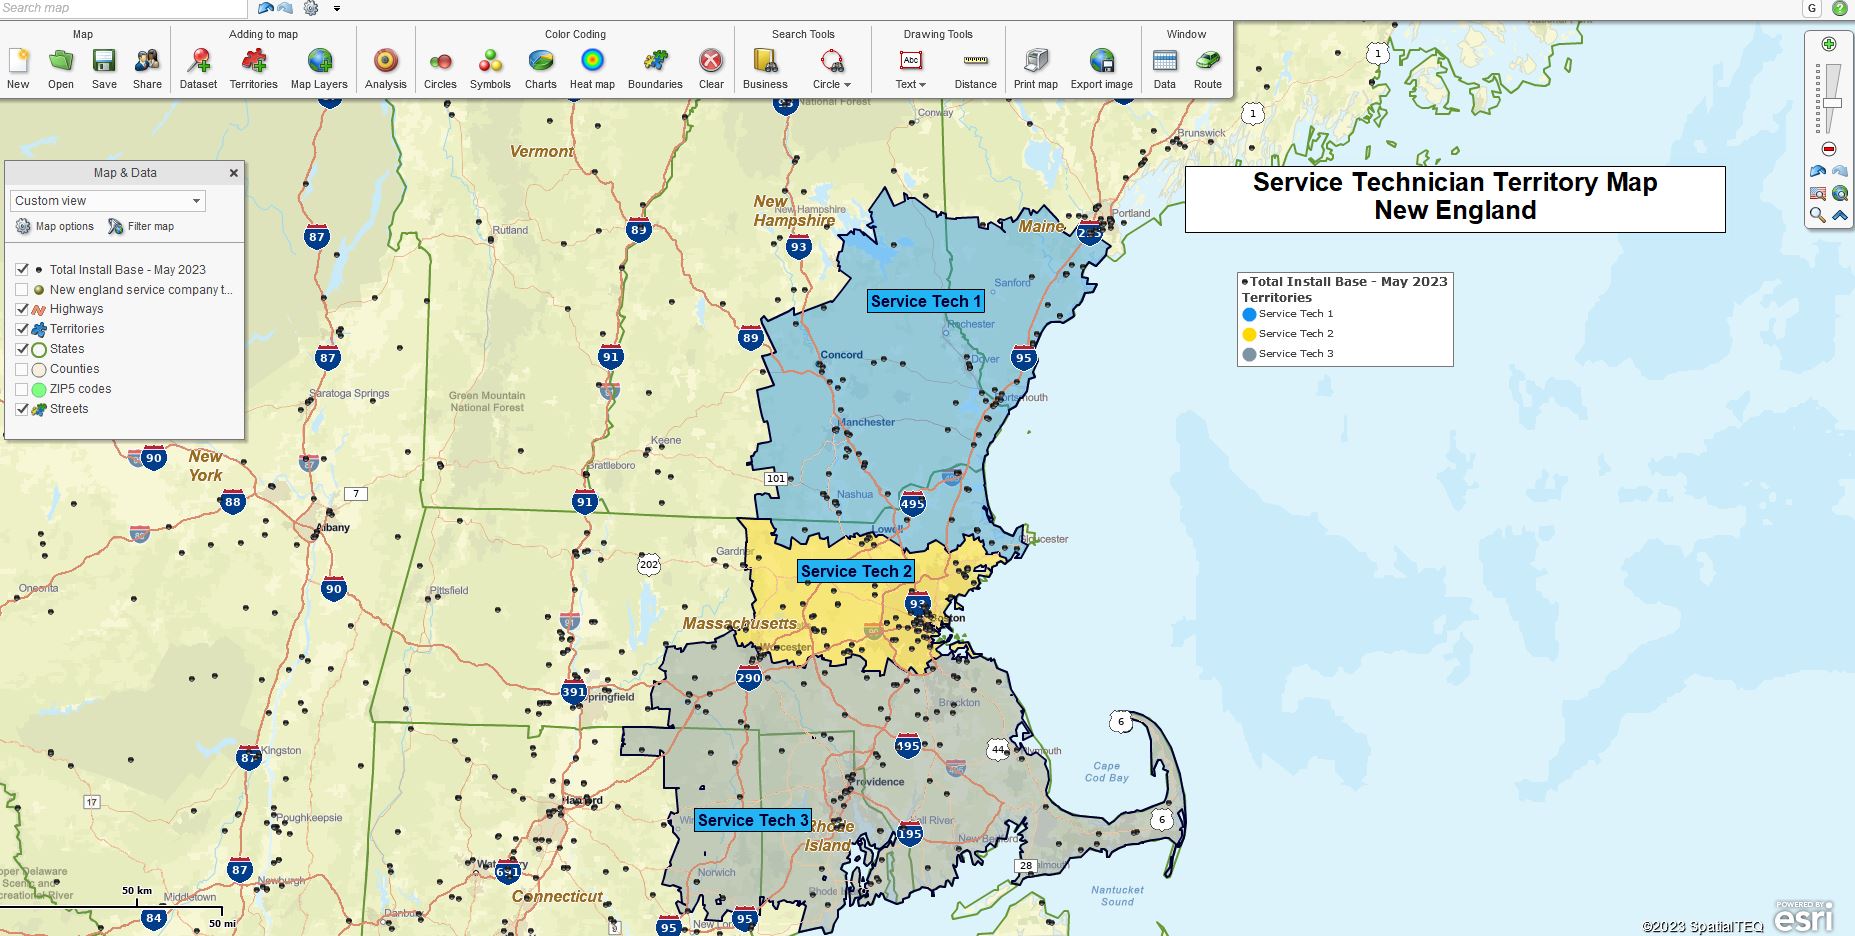
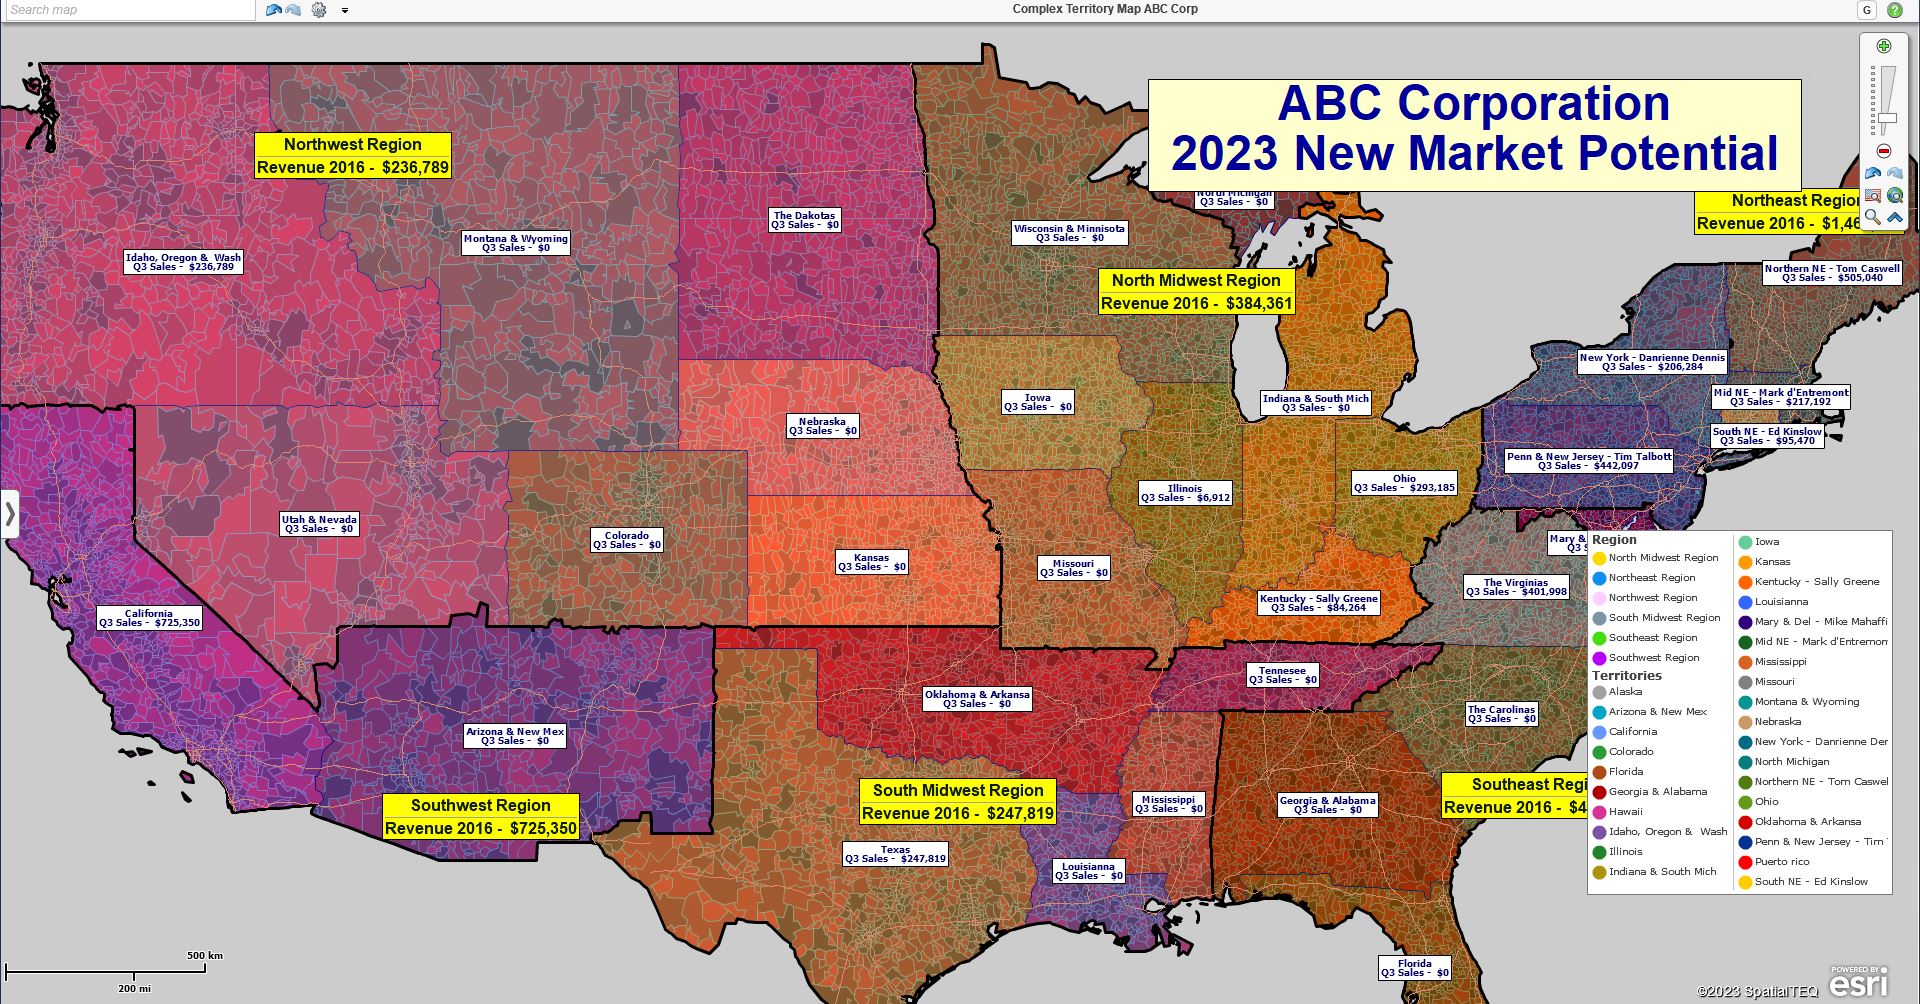
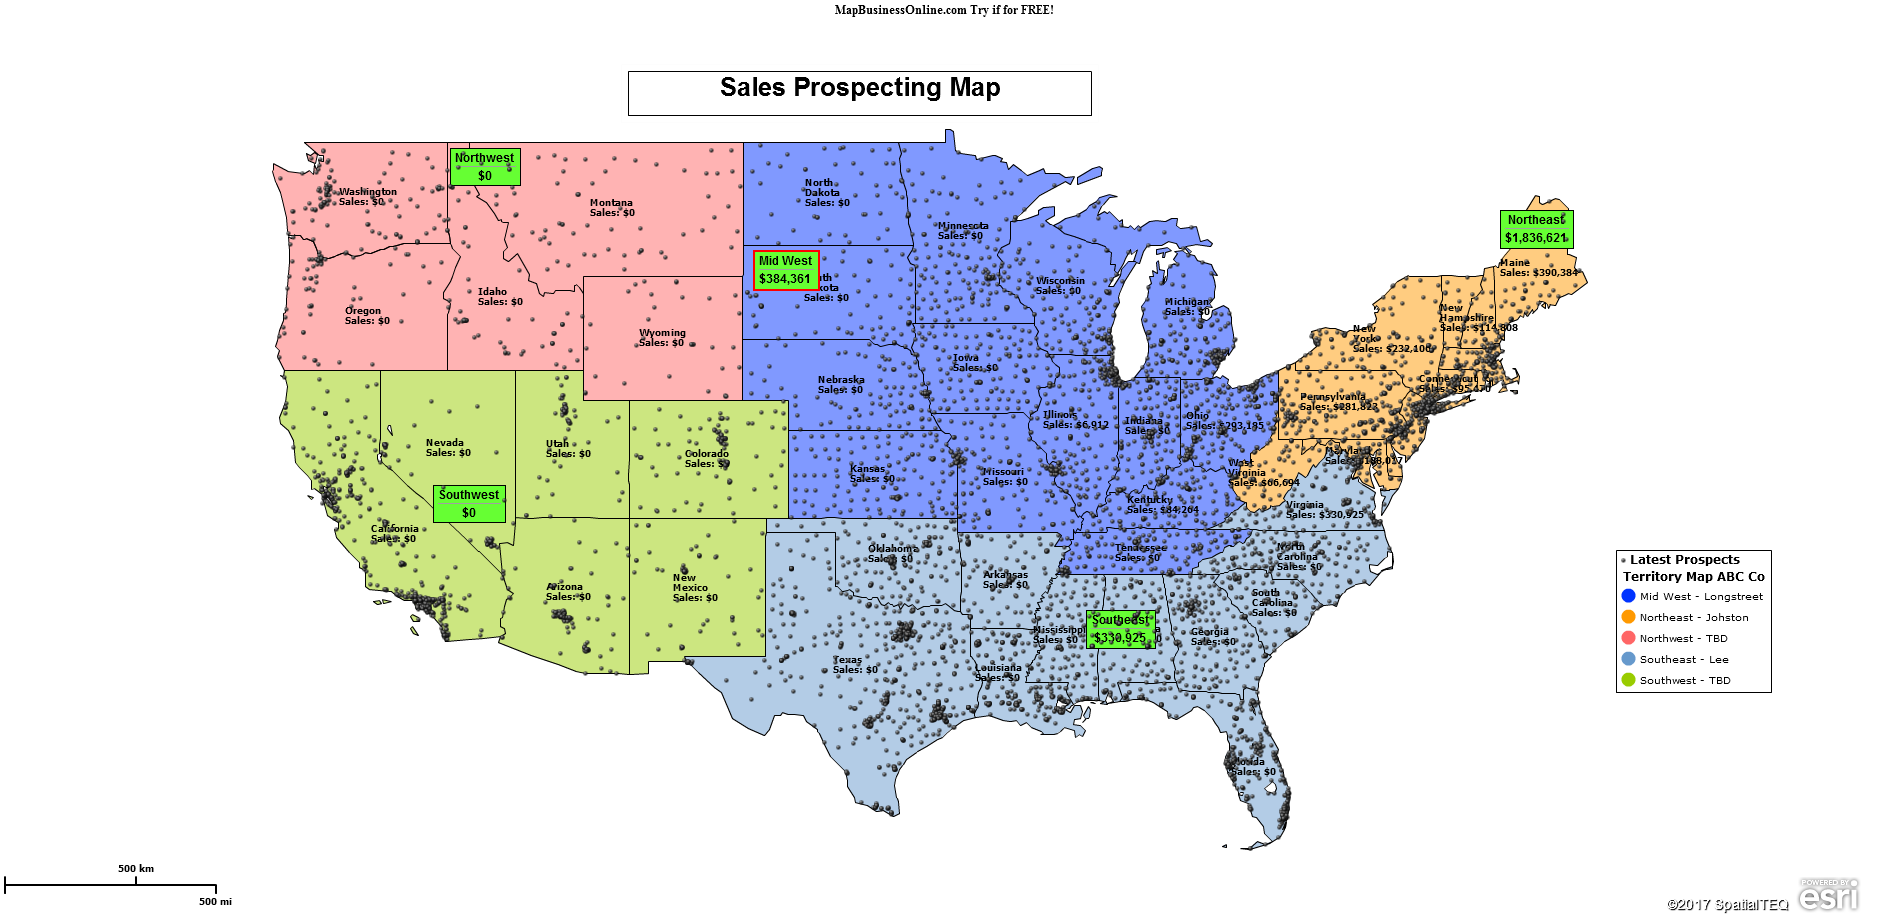
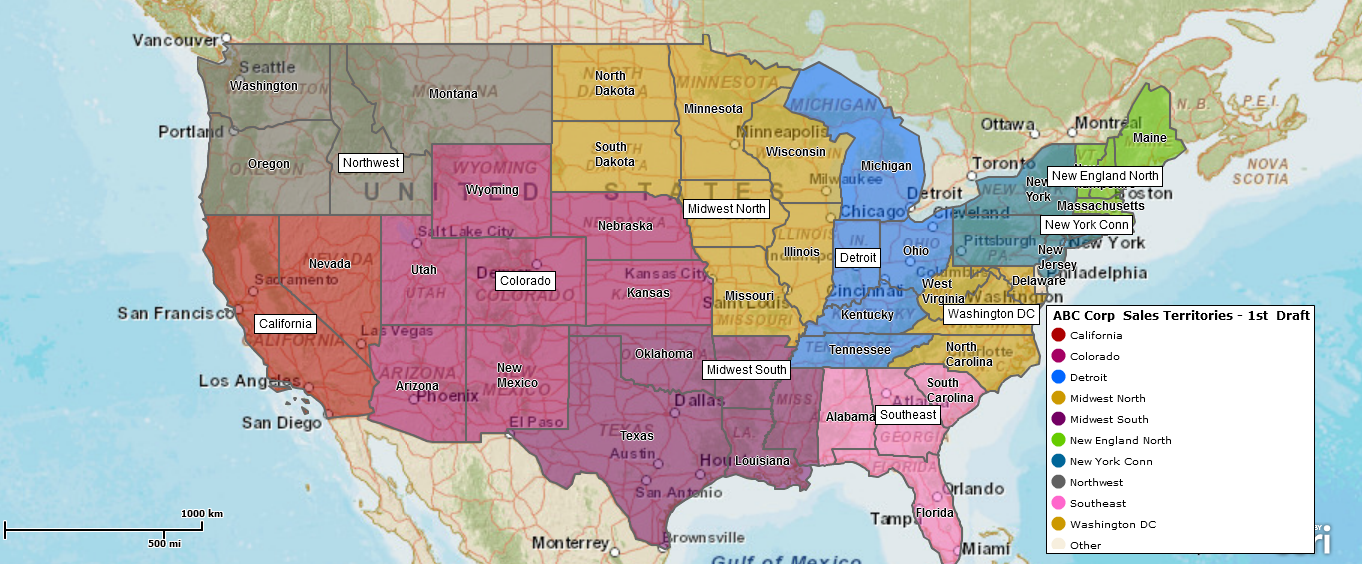
A service territory map created using MapBusinessOnline.

The Driving Time Difference

Time is a factor that differentiates service territory management from traditional MapBusinessOnline sales territory management. The service industry must deliver its offerings quickly and on time.

The concept of ‘Service’ implies a timely arrival of a repairperson or technical service rep to implement a fix for a broken or faulty device, software, or system upgrade. Service businesses use business mapping software to create and analyze service areas. Service territories are monitored over time to monitor on-time statistics.

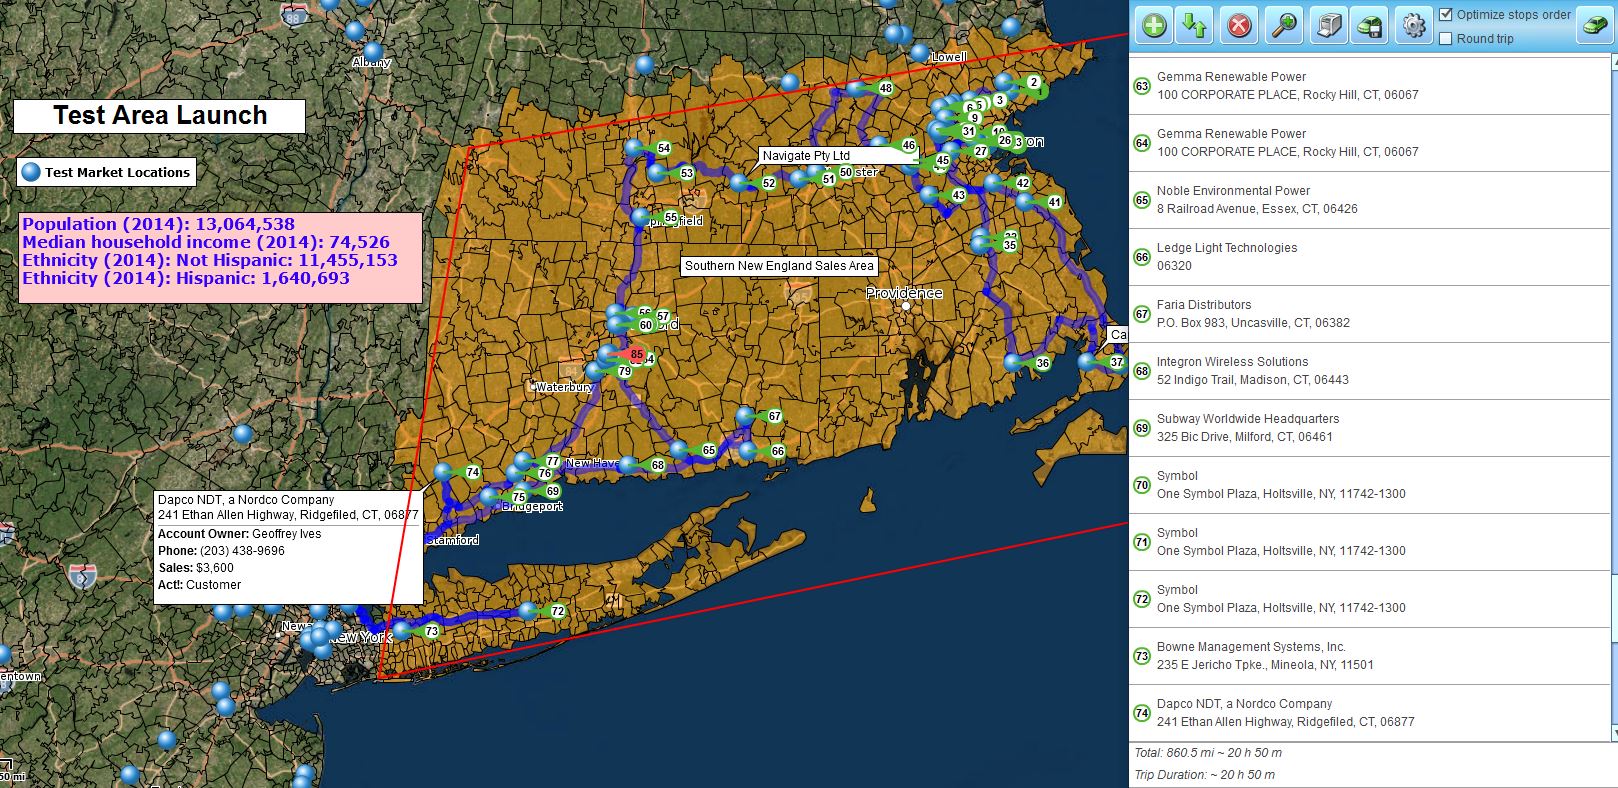
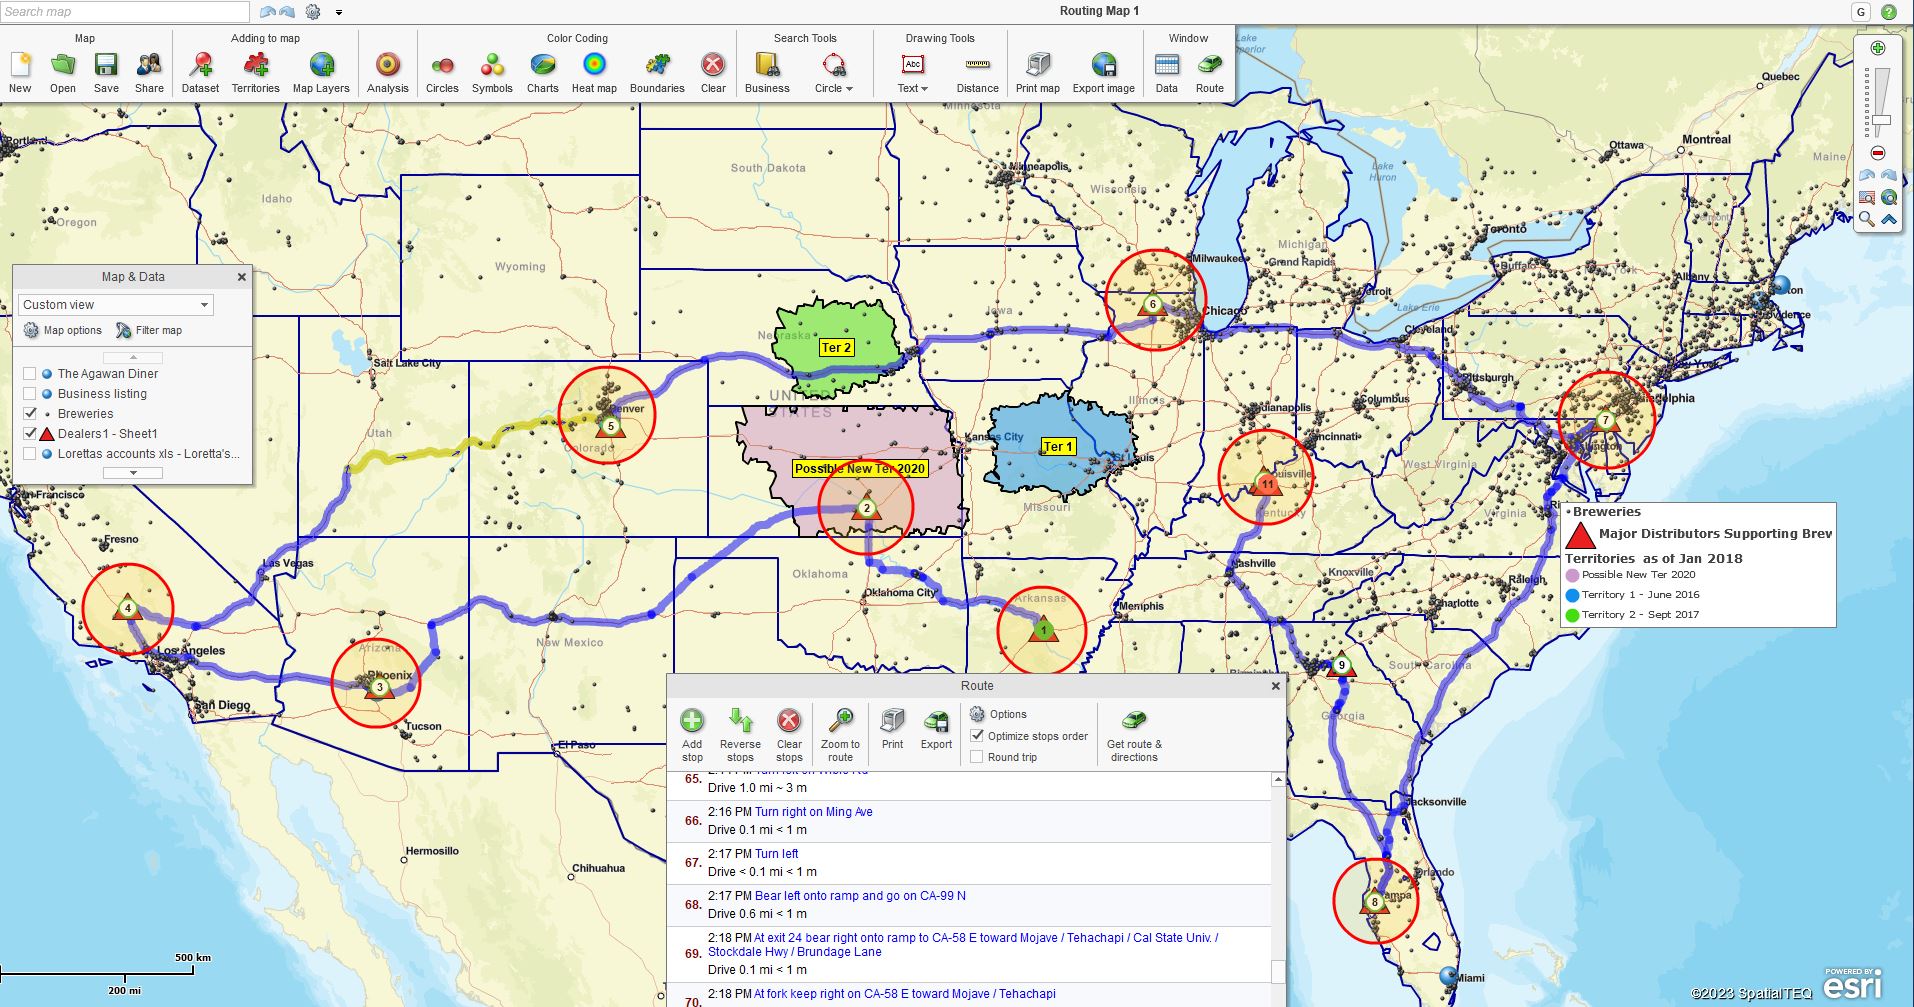
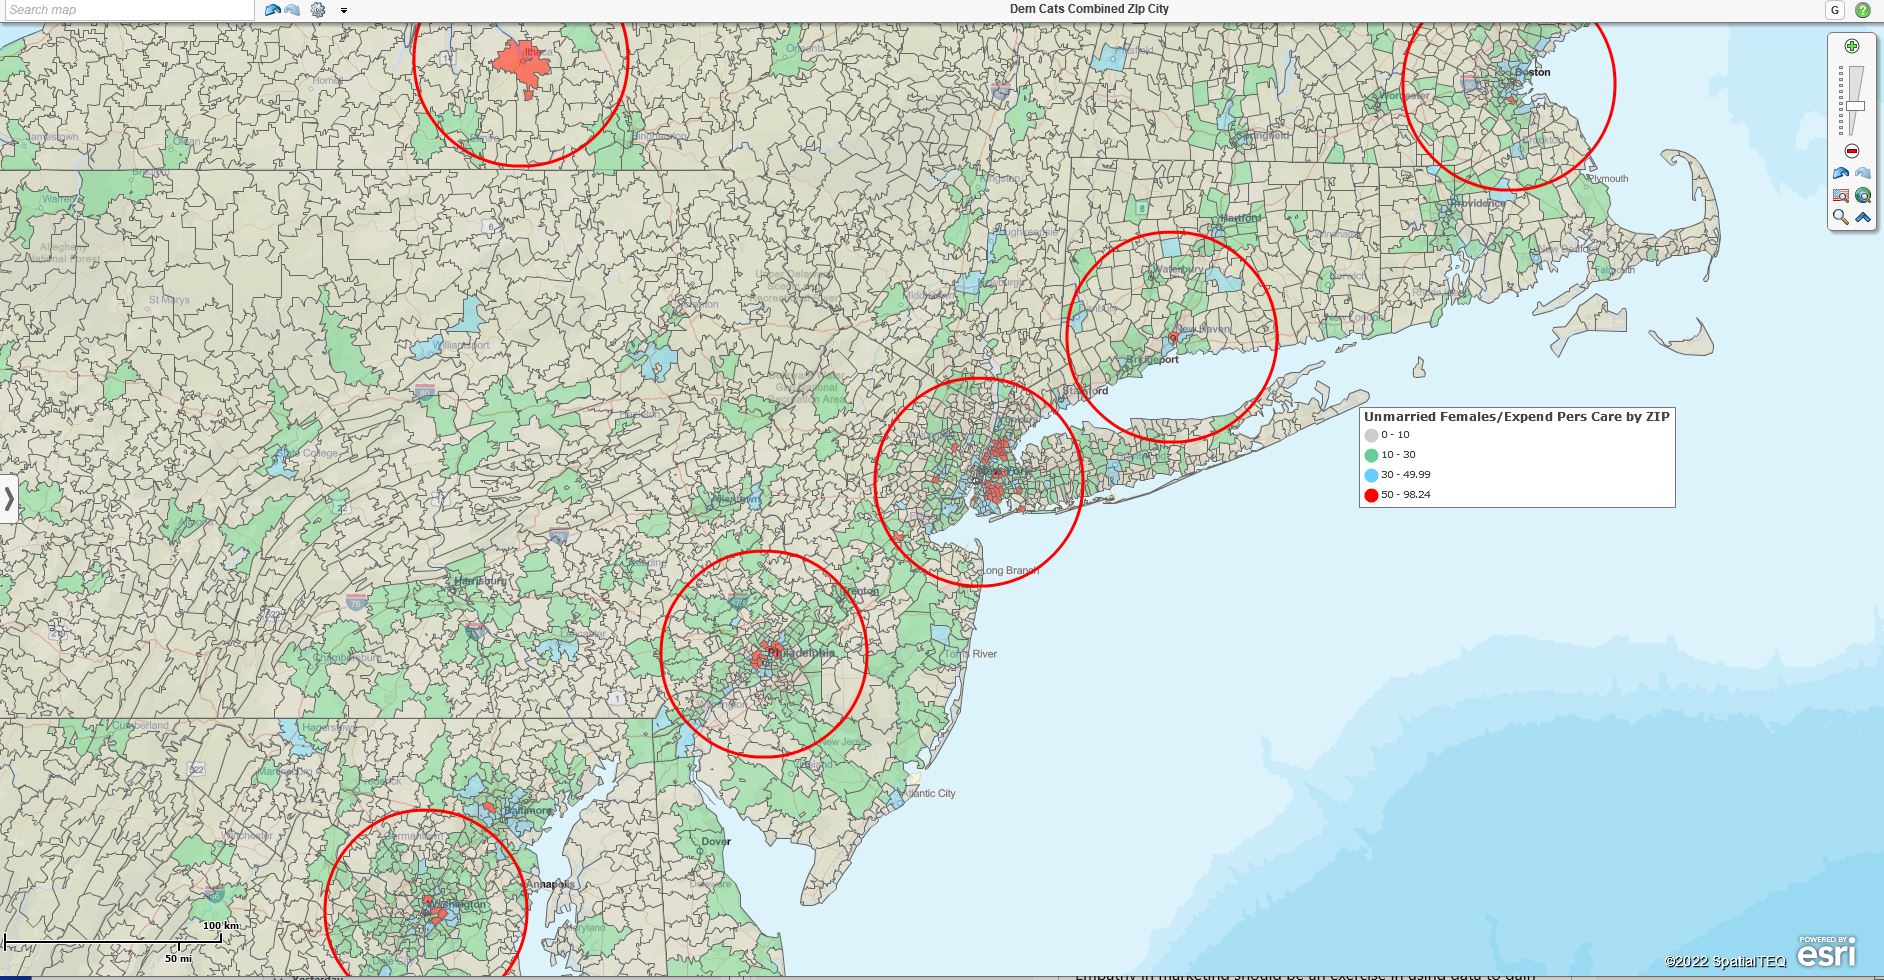
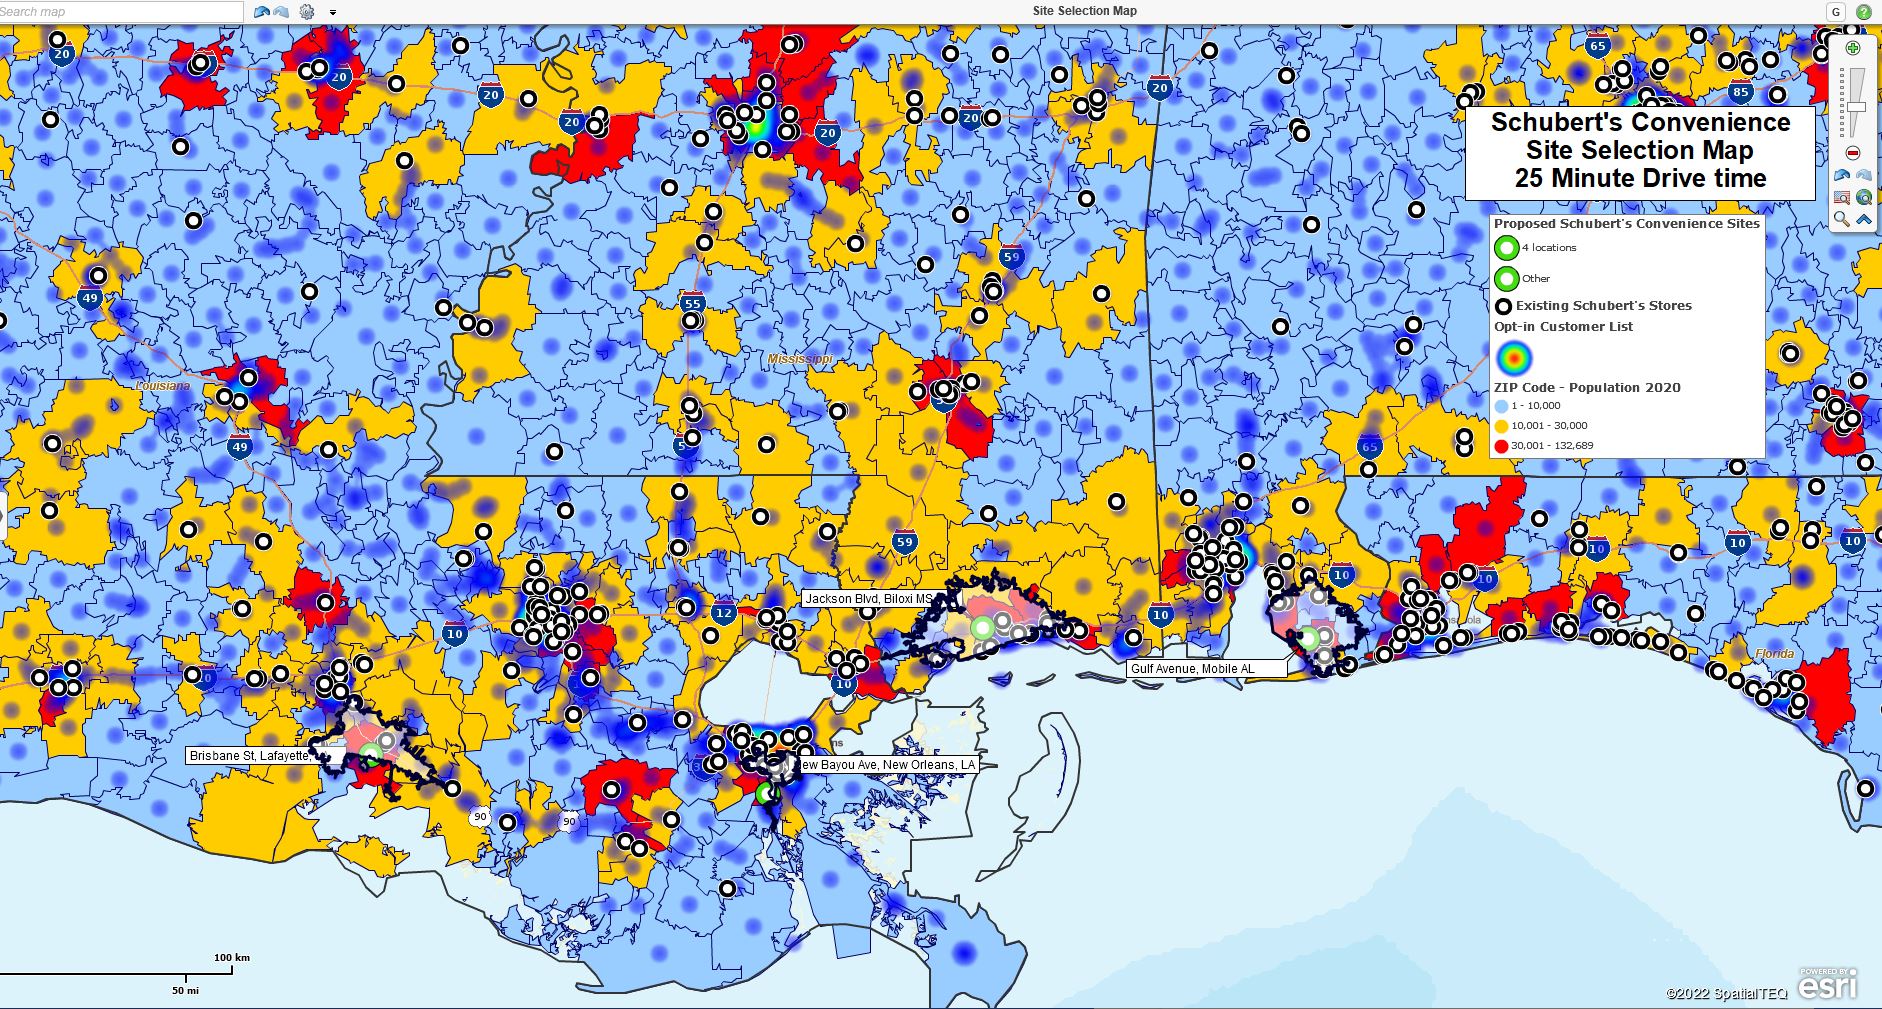
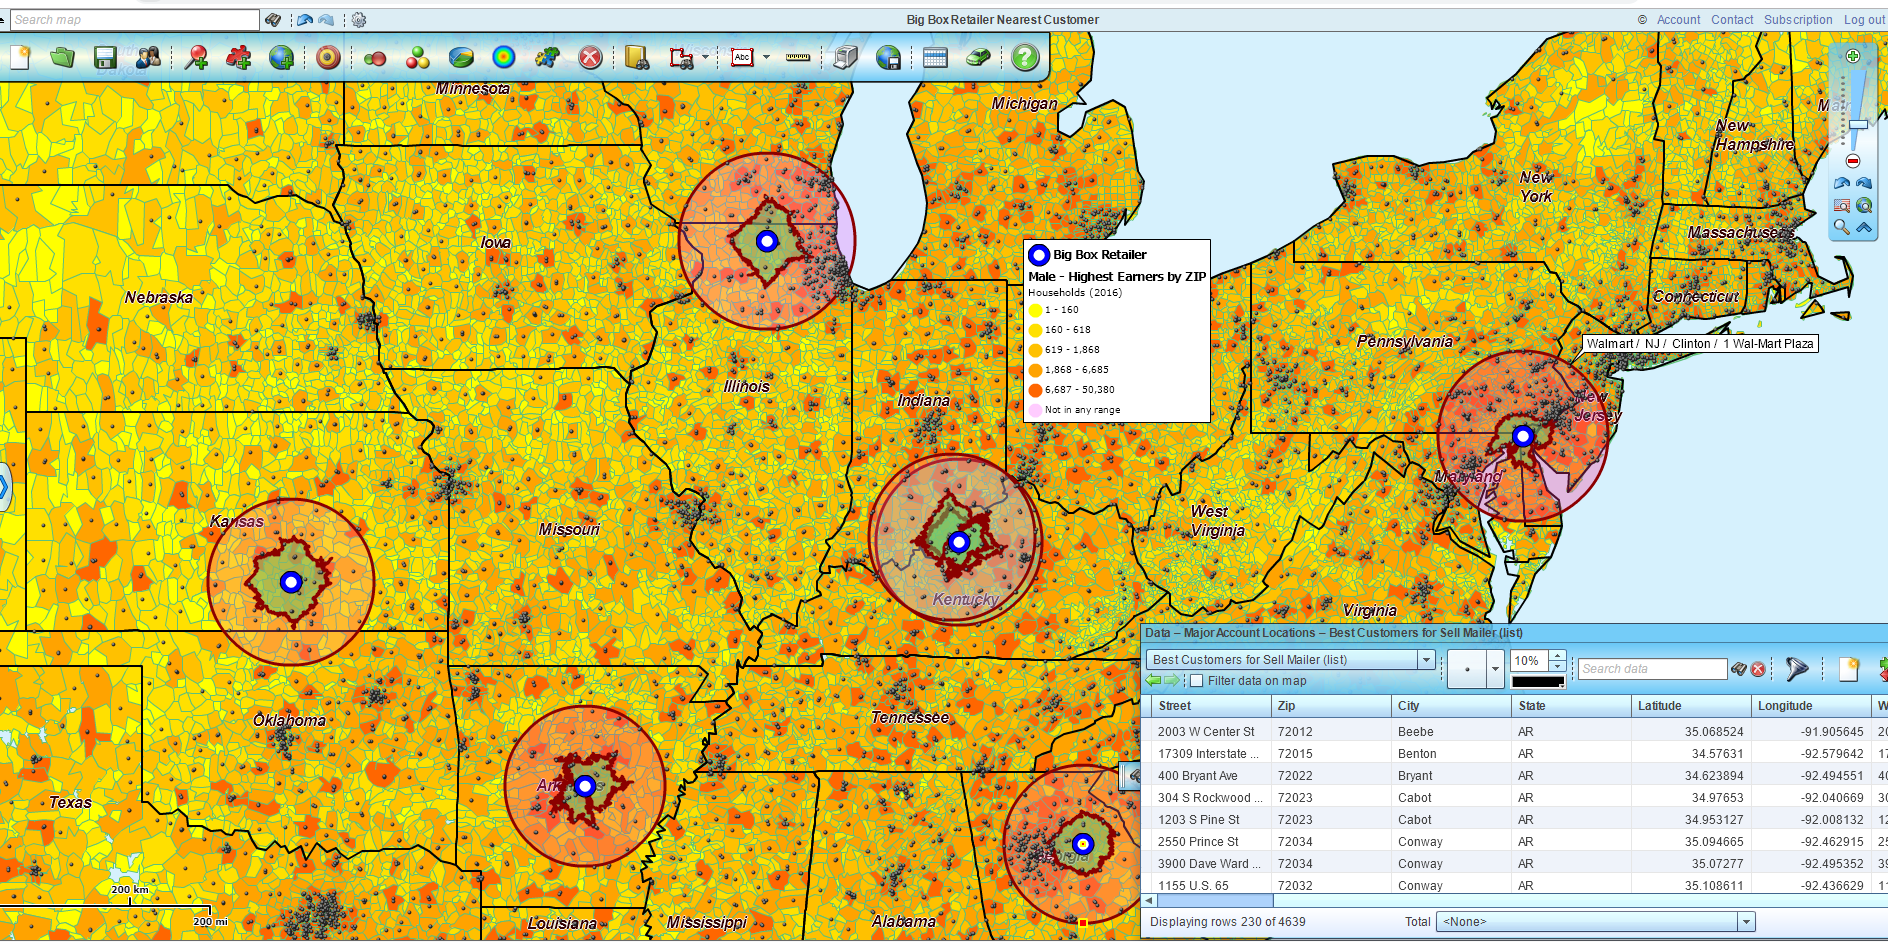
MapBusinessOnline coverage area maps can describe driving time and distance areas around a central starting point. Service organizations often use these driving time or distance outreach/delivery zones to establish pricing for service calls and delivery fees. Concentric circle maps are often applied to this delivery scheme by area or zone. Learn more.

Major tech companies that offer repair services often establish multiple zones for repair coverage. Zones are generally centered around large population pools and segmented into ½ day, one-day, and two-day travel times. Service territory maps offer rapid response times to high-population areas while offering some rural coverage to those less than a day’s drive away. Outside of those ranges may require customer delivery to a repair center for rework.

Concentric Circle maps are often used to generate delivery zones and fee structures.

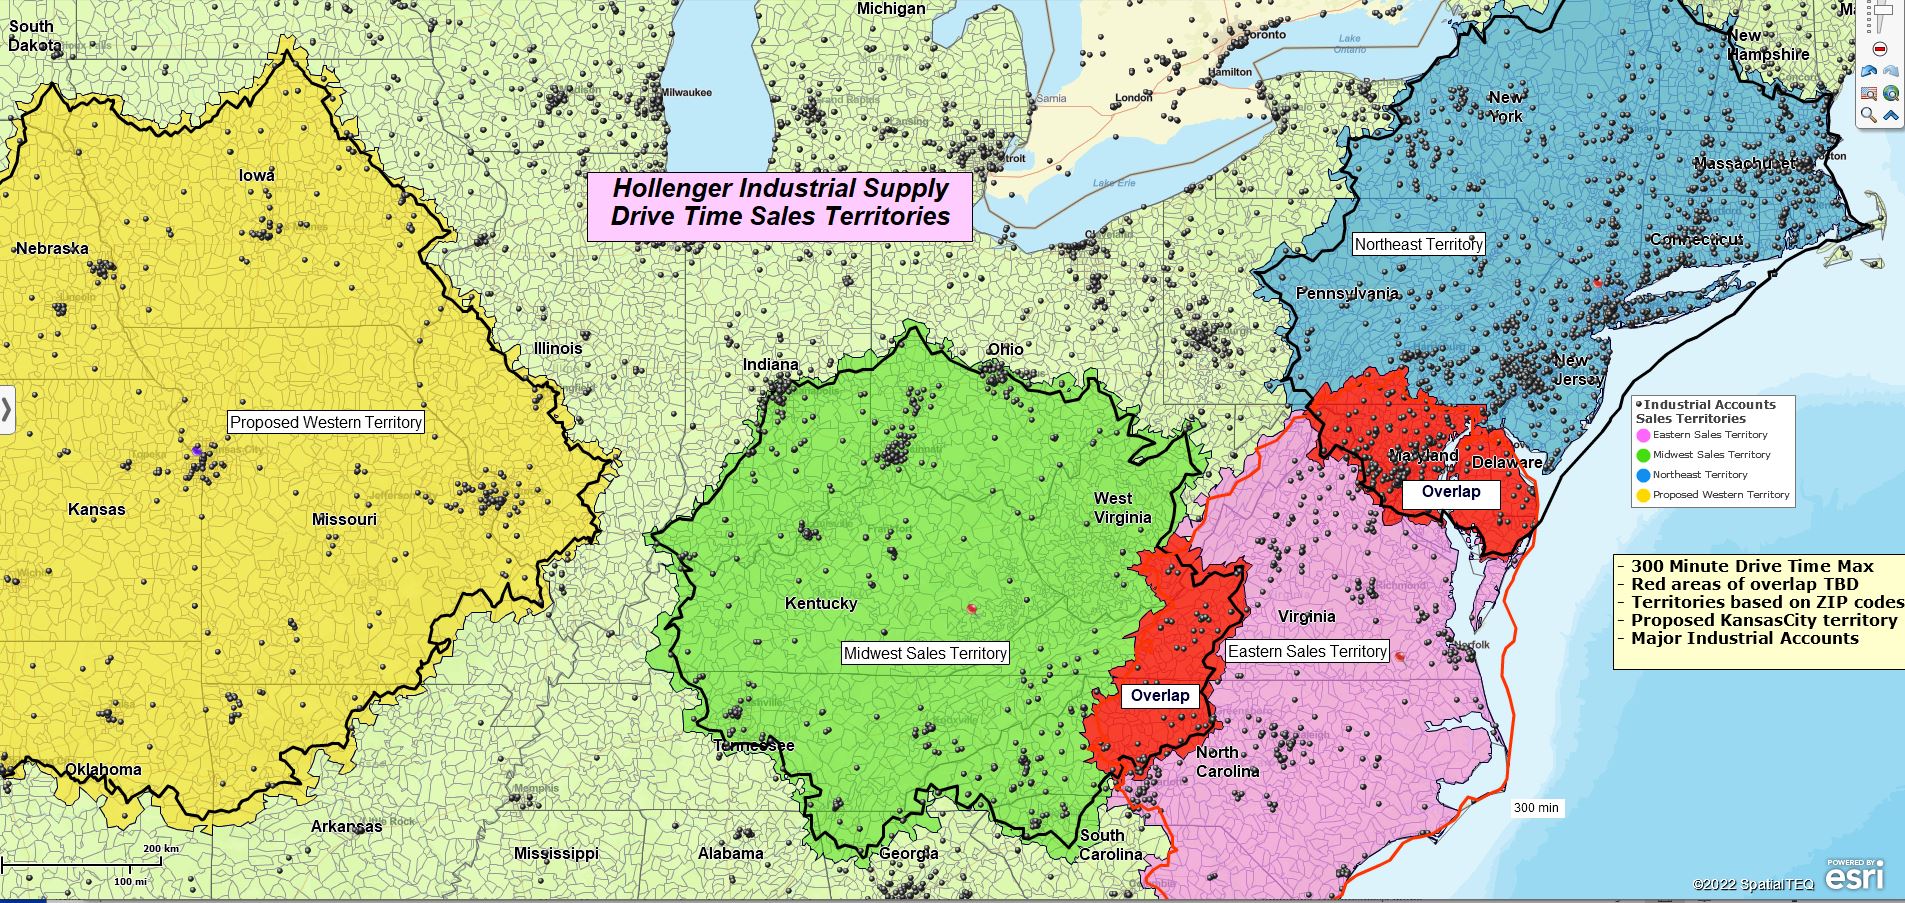
Service territories can be created based on a multiple-center point query at specified driving times or distances. For example, a rental agency with 150 outlets could derive 150 territories based on a 30-minute drive time polygon around each outlet. This is a highly convenient way to create Zip code-based territories that reflect a known customer-tolerated driving time or distance period.

In addition to driving time analysis, MapBusinessOnline provides time arrival and stop duration support in the optimized routing tools. The vehicle routing software estimates times and distances for every generated route and segment.

Service Territory Analysis

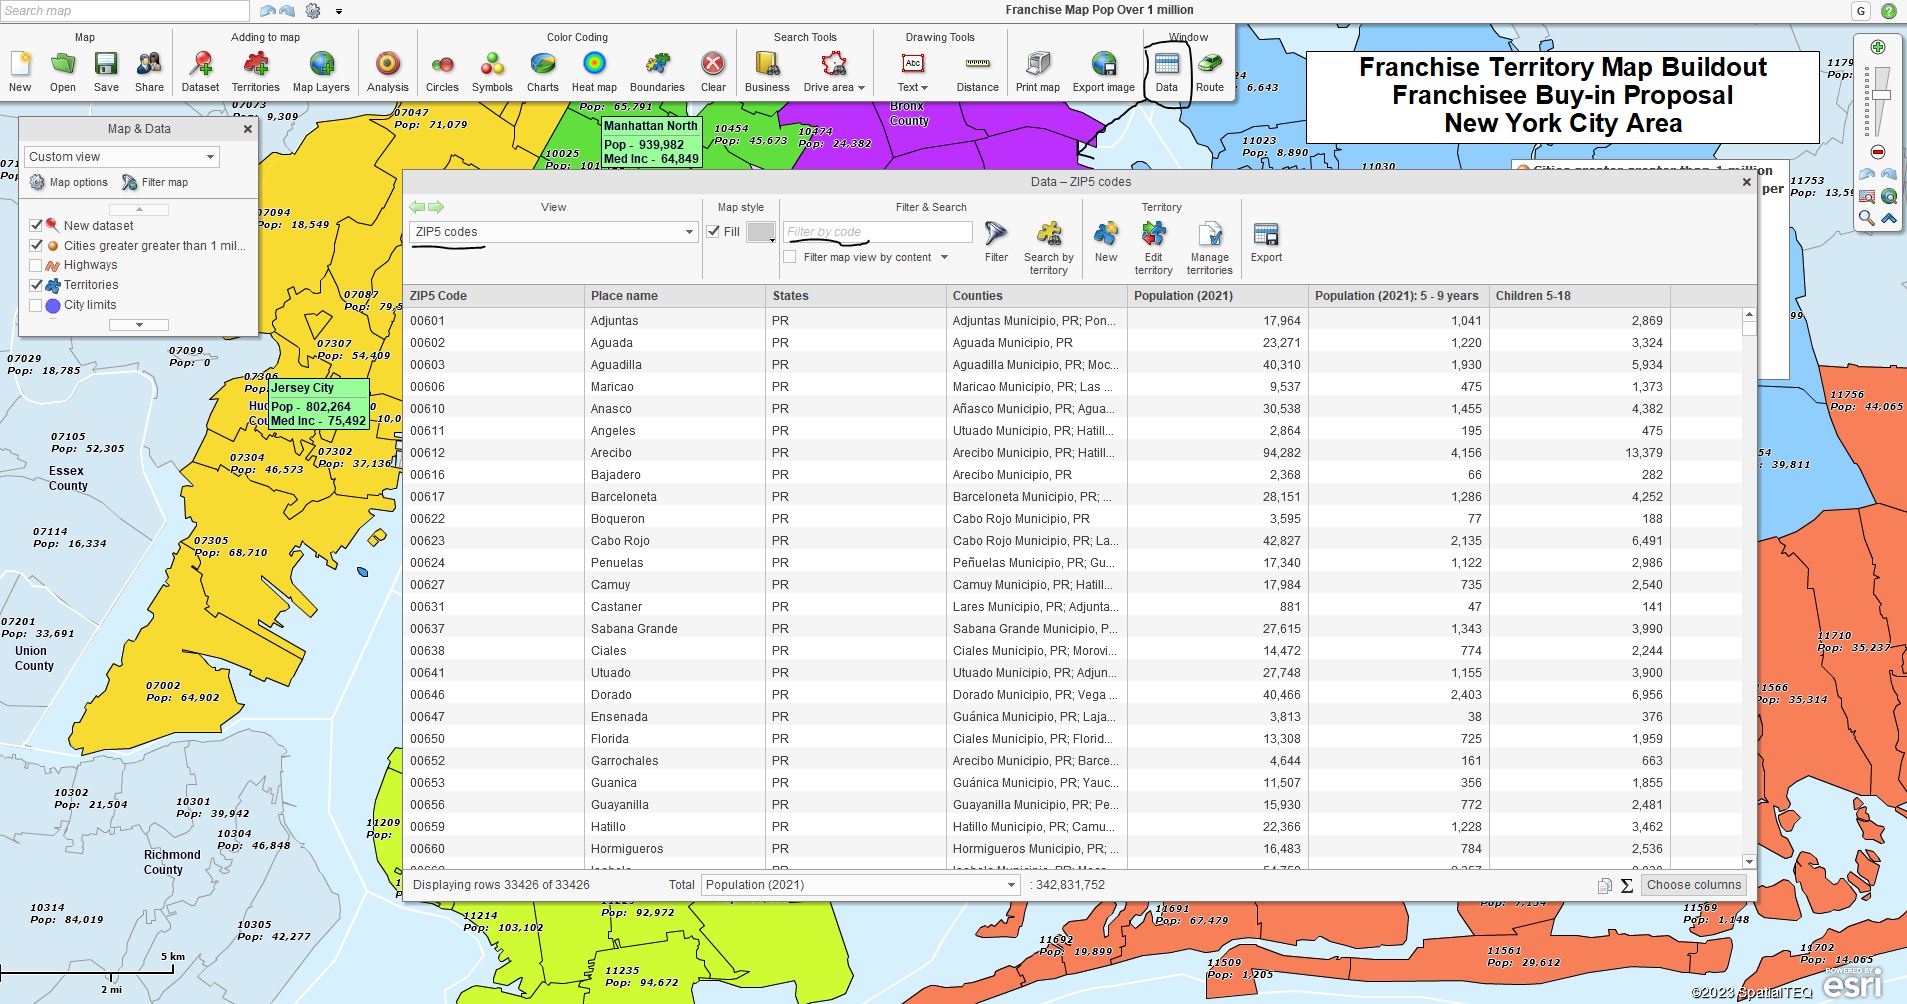
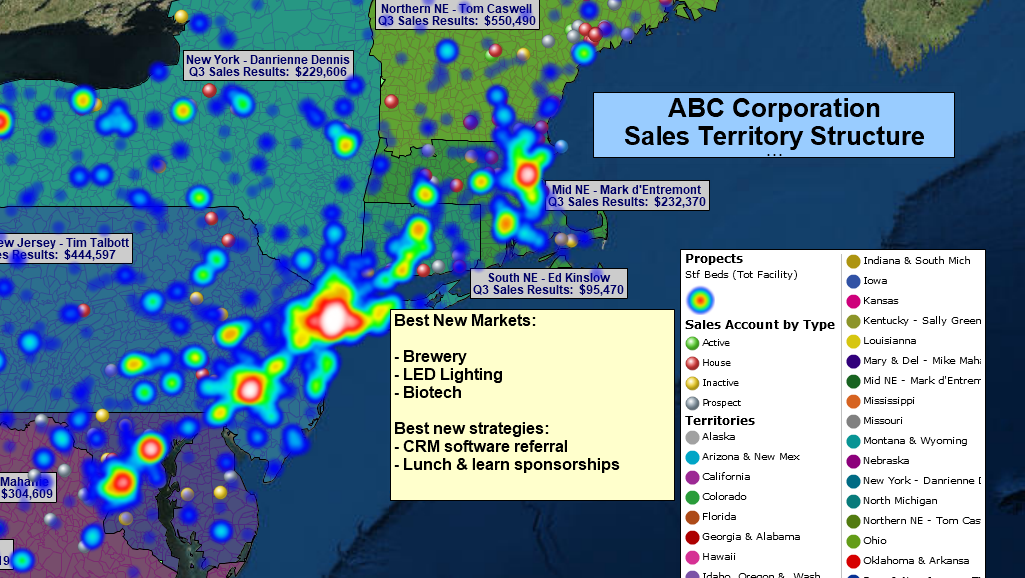
MapBusinessOnline service territory maps provide analysis views to help measure progress toward company goals. The Data Window provides tabular data views of imported data layers. Industry location data can be easily imported into any business map and compared to organizational data.

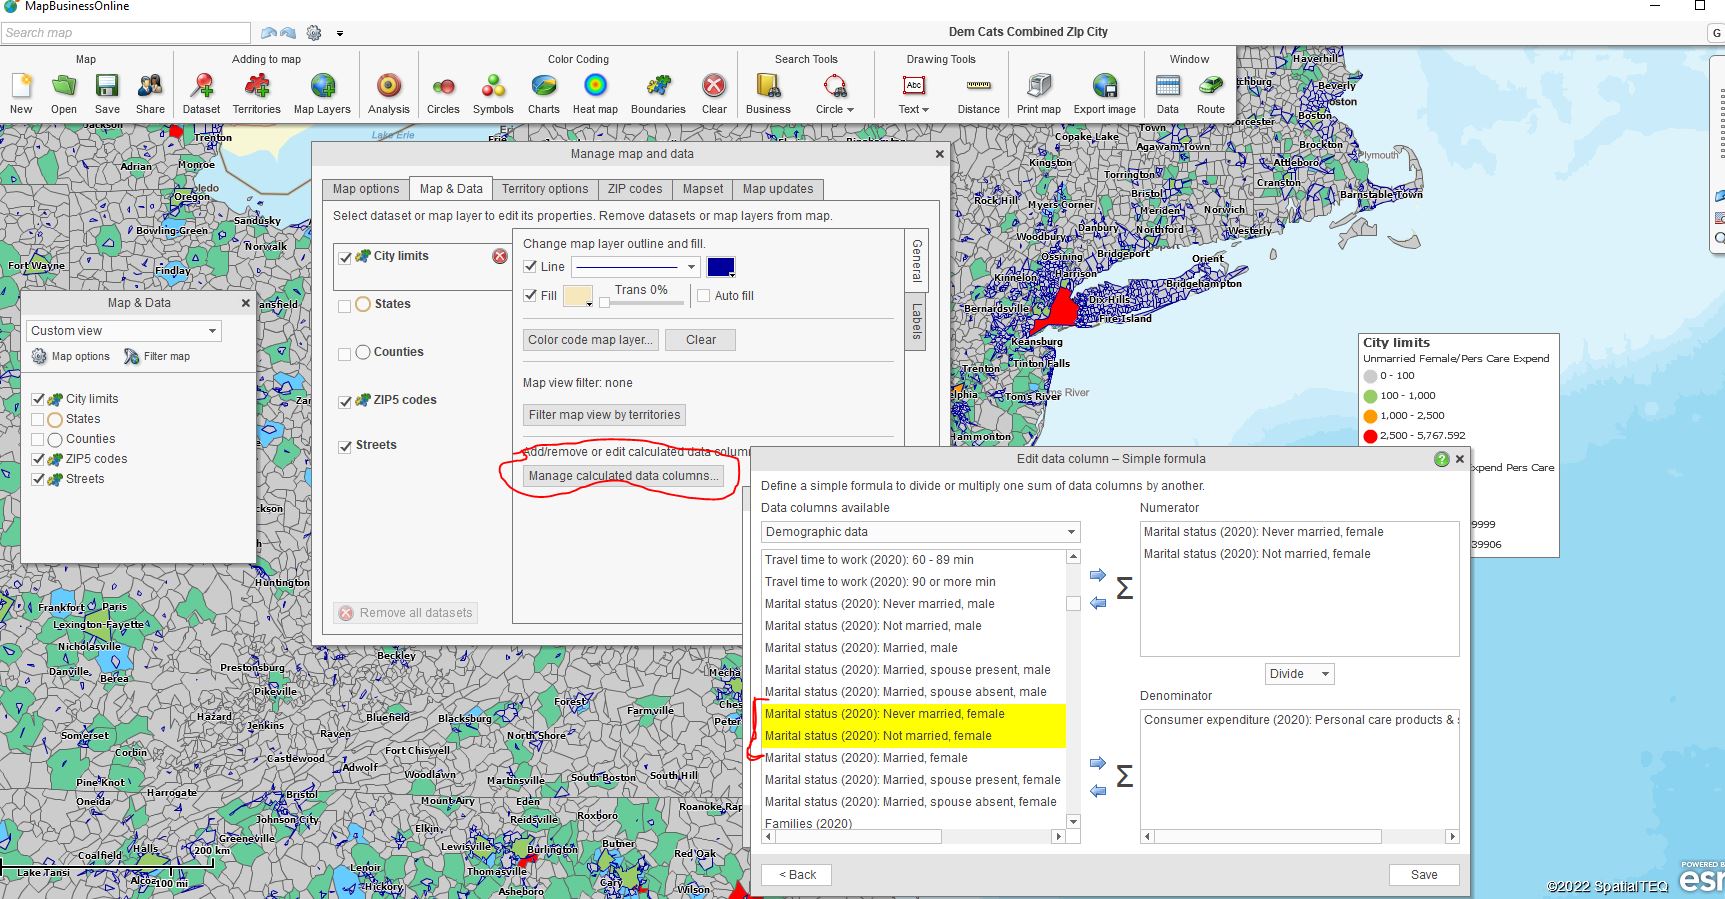
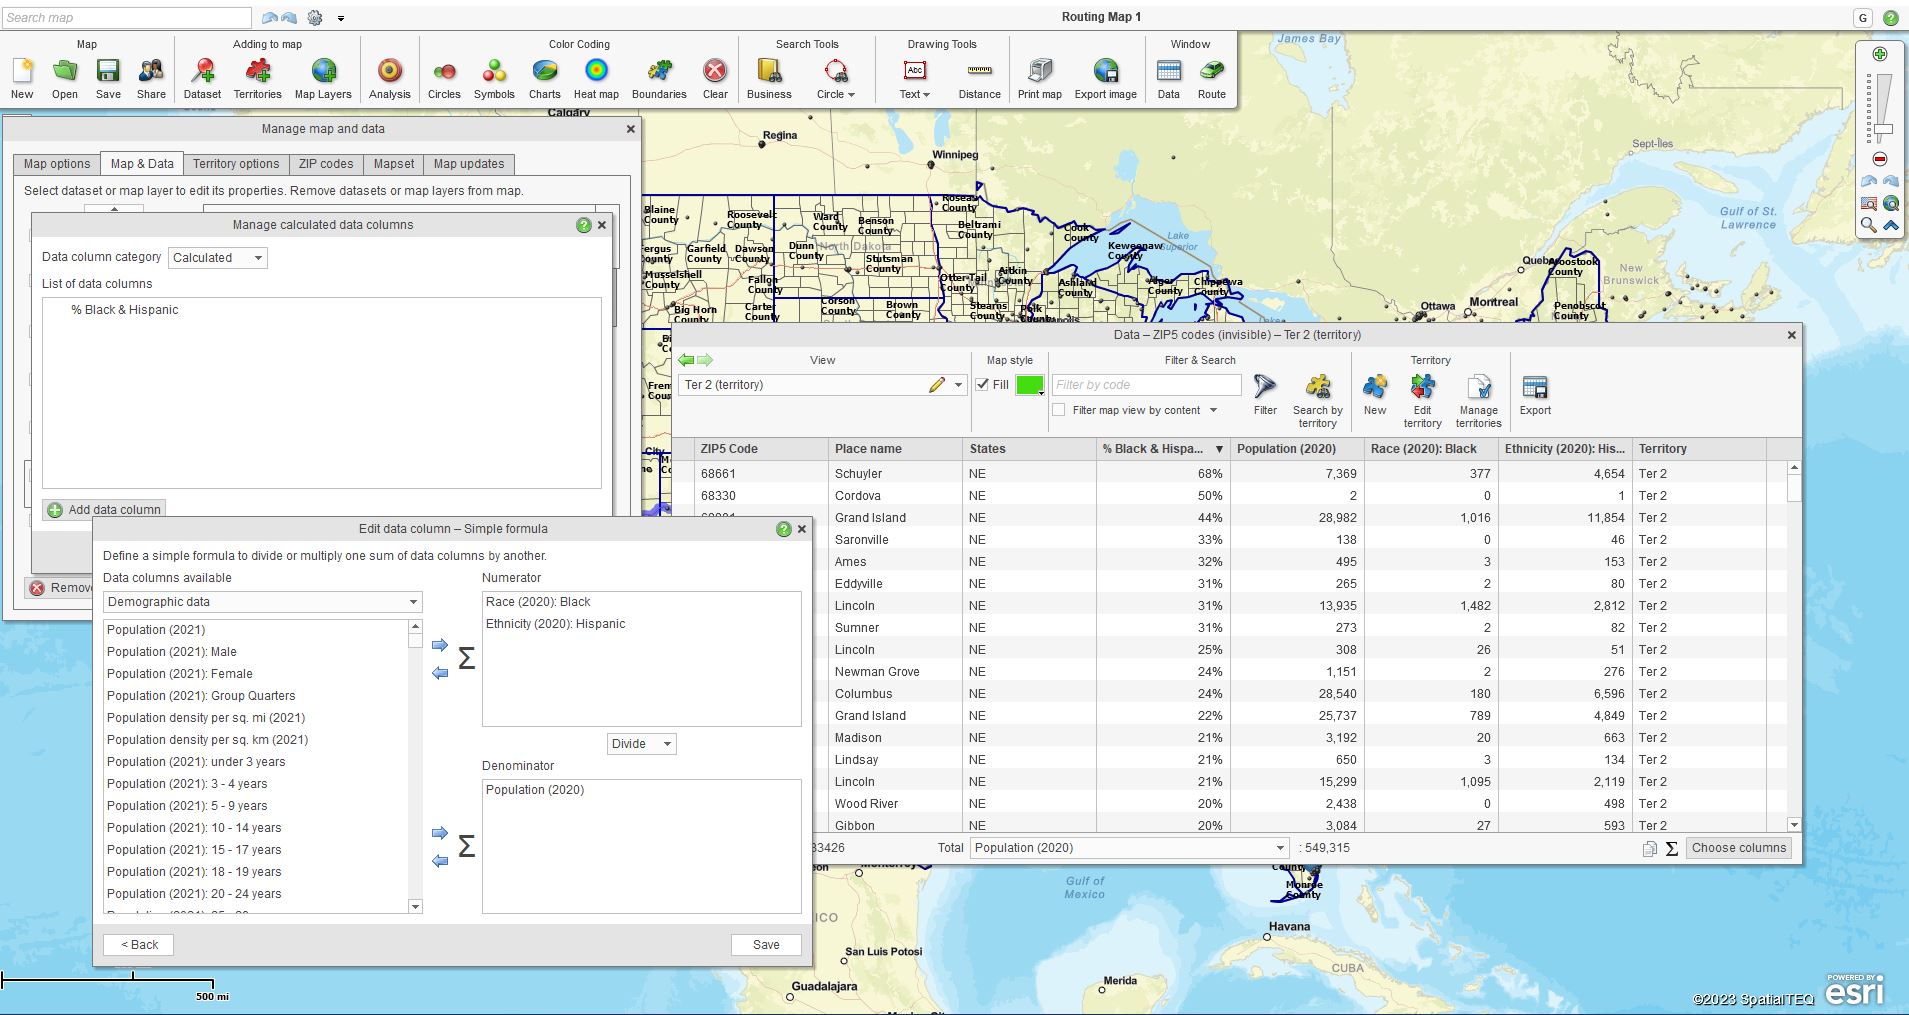
Import the industry data into MapBusinessOnline and add the relevant columns of the data to the territory analysis using the Choose Column button in the lower right of the Territory analysis view. For example, industry statistics on specific medical incidents can be compared to organizational responses to determine market share. Learn more.

In this way, a business can compare industry location data to organizational data and derive market share, measuring progress against the competition.

Analysis views in service territory mapping can easily access and analyze Census demographic data categories. MapBusinessOnline includes a comprehensive library of demographic data for use in strategic and expansion planning. Learn more.

Create percentage calculations comparing demographic data to collected business statistics. MapBusinessOnline includes a calculated data columns function for summing and comparing like datasets. The Data Window also consists of a summation box at the bottom of the tabular view for quick sums of any column. Click the header of any data column to cycle through descending or ascending views.

Enhance your service delivery organization through service territory management. An efficient traveling field force is an asset to any service business. Make service territories part of your business success story.

_______________________________________________

Discover why over 25,000 business users log into www.MapBusinessOnline.com for their business mapping software and advanced sales territory mapping solution. The best replacement for Microsoft MapPoint happens to be the most affordable.

To access MapBusinessOnline, please register and download the Map App from the website – https://www.mapbusinessonline.com/App-Download.aspx.

After installing the Map App, the MapBusinessOnline launch button will be in the Windows Start Menu or Mac Application folder. Find the MapBusinessOnline folder in the Start Menu scrollbar. Click the folder’s dropdown arrow and choose the MapBusinessOnline option.

The Map App includes the Map Viewer app for free non-subscriber map sharing.

Please read customer reviews or review us at Capterra or g2crowd.

Contact: Geoffrey Ives at geoffives@spatialteq.com or Jason Henderson at jhenderson@spatialteq.com.

Posted in Business Mapping Software blog post, How to instruction | Tagged , , , , , | Leave a comment

Determining an Area’s Population Percentages by Ethnicity Using MapBusinessOnline

MapBusinessOnline business mapping software includes access to an entire library of Census demographic data. This data can be used to develop thematic maps based on demographic topics, summations, and calculations using multiple categories – including ethnicities.

In this example, MapBusinessOnline answers, ‘In a defined area, what are the Black and Hispanic portions, as a percentage, of the total population?’

Political analysis of populations is used to enhance polling indications, voter canvassing planning, and perhaps just political planning in general. Understanding the details behind an area’s total population can benefit various analyses. I imagine a political newbie considering a run for a Senate or Representative seat might want a handle on what ethnicities make up the electorate they are messaging.

Sales and Marketing professionals also seek to understand population breakdowns as they consider launching campaigns supporting large retailers or political action groups. All those issue-based direct mail pieces we throw away at home are not cheap. Great for starting a woodstove fire, though.

City and county planning offices like to monitor population shifts to maintain relative equity across neighborhoods. As rougher neighborhoods become more gentrified or vice versa, city elected officials are responsible for treating citizen homeowners and renters fairly, without creating ‘Red Zones’ or gated communities for the well-to-do.

The professionals mentioned above need an easy and fast way to gather that information. The data should be available for large areas, as extensive as a state, and for small areas, as small as ZIP codes or even Census tracts. Fortunately for you, affordable MapBusinessOnline is here with just the ticket.

A subscription to MapBusinessOnline business mapping software includes access to Census demographic data. The list of categories is comprehensive and consists of the following:

  • Overall population estimates as well as significant ethnicity breakdowns.
  • Household and median income levels.
  • Household totals, as well as head of household estimates.
  • Age breakdowns by populations.
  • Income breakdowns by population.
  • Major consumer expenditures.
  • Home ownership and rental estimates.
  • Many more categories, too numerous to list here.

Use Calculated Data Columns to Combine Demographic Categories or Create Simple Formulas.

Determining the Ethnicity Population Breakdown

Step 1 – Choose your area of interest.

We will be using MapBusinessOnline’s territory mapping tool to develop our breakdown. Territory management software is excellent for many applications, including sales territory creation, service territory management, franchise territory management, and, in our case, market and demographic analysis.

Areas of interest can vary widely. In your business, someone will ask for a relevant area – a five-mile radius around a major population center. A customized polygon might be appropriate for more wonky areas with known lopsided population anomalies.

  1. Once an area is targeted, choose your polygon or radius option from the Search Tools on the Master Toolbar, and draw the area.
  2. Use the Search option in the associated popup menu to search for the list of ZIP codes bounded by your map object. (ZIP codes are the most popular alignment layer for demographic analysis.)
  3. Save that result as a Territory with a name that means something relevant to your project.

Note: Any map object on the map can be searched for ZIP codes (or counties, Census tracts), but the resulting ZIP codes won’t match the exact area of a circle or polygon. Considering that Census demographic results are always an estimate, in most cases, the results are good enough. However,  the map creator does have the option, in Map and Data – Map Options, to adjust the extent of ZIP code/Area overlap. 

Click – Map Options – Edit Search Options. Click the dropdown to explore the intersection options – Intersect – Intersect at least 50% – Fully inside. These adjustments would impact spatial queries with any map layer intersection – ZIP code, State, County, or City Limit.

Create A Calculated Data Column

Back to our story.

With your territory assigned, we must develop a Calculated Data Column with a formula for percentages applicable to the two ethnicities within the total population.

  1. Go to Map and Data. Because we used ZIP codes as our alignment layer, Click into the ZIP code layer. Select Calculated Data Columns – the bottom option.
  2. Click Add Data Column. Name the Column – ‘% Black & Hispanic.’ (Your choice.) For format, in this case, select ‘Percentage.’ Set numbers or decimals as required.
  3. Click Formula Options and Simple Formula.
  4. Next is the Demographic Data selection process.
    1. Because it is a % of the total population, move the Total ‘Population (2021)’ to the right as the Denominator.
    2. Move the ethnicity populations you’re interested in (Black & Hispanic) to the right as the Numerator. (Isn’t using Denominator and Numerator labels at work fun? 4th Grade math.)
  5. Click ‘Add’ in the lower right. Your formula is now created as a Calculated Data Column and is accessible in the Data Window analysis view.

Return to the Data Window and drop down to your Territory.

  1. In the lower right, click Choose Columns.
  2. On the left side of the two-sided database tool that opens, drop down to the Calculated option for pulling data into the analysis. Find your Calculated Data Column named dataset. Move it to the right side.
  3. If it suits your project, you can drop down to Demographic Data and move various Demographic categories into the analysis. For instance, Pacific Islanders may represent only .5 percentage points of the total population, but listing that population segment may add value to your analysis.
  4. Click Set Data Columns.

Take a look at your territory in the Data Window. You now have ethnicity categories noted by percentage. High-fives all around.

Calculated Data Columns formula for analyzing % of the population.

The Results – Reporting on Your Demographic Analysis

Once your demographic analysis of the ethnicity percentage of the total population is complete, you have several options for reporting:

  1. Use MapBusinessOnline – the software, via a web share meeting or an overhead projector. Once you’re familiar with the tool, you will find using it as a live-sharing tool advantageous.
    1. You’ll have more flexibility to turn layers on and off as part of the presentation.
    2. To answer questions, you could quickly upload more categories of demographic data live.
    3. You’ll become known as the company Map Geek. (This cuts both ways.)
  2. The Data Window tabular view of demographic information, including your formula results, is exportable. Use the right-most button on the Data Window toolbar to export to a CSV file.

I think the above exercise in demographic mapping is an excellent example of how MapBusinessOnline provides advanced analysis capabilities for everyday businesspeople. The tool is both easy-to-use and affordable. And you get to use the terms Denominator and Numerator without having to apply to SpaceX for a trip to Mars.

Captain Numerator and Lieutenant Denominator relax at the Martian landing site – 2036 – while Private Dividend records. (SpaceX Image.)

_______________________________________________

Discover why over 25,000 business users log into www.MapBusinessOnline.com for their business mapping software and advanced sales territory mapping solution. The best replacement for Microsoft MapPoint happens to be the most affordable.

To access MapBusinessOnline, please register and download the Map App from the website – https://www.mapbusinessonline.com/App-Download.aspx.

After installing the Map App, the MapBusinessOnline launch button will be in the Windows Start Menu or Mac Application folder. Find the MapBusinessOnline folder in the Start Menu scrollbar. Click the folder’s dropdown arrow and choose the MapBusinessOnline option.

The Map App includes the Map Viewer app for free non-subscriber map sharing.

Please read customer reviews or review us at Capterra or g2crowd.

Contact: Geoffrey Ives at geoffives@spatialteq.com or Jason Henderson at jhenderson@spatialteq.com.

Posted in Business Mapping Software blog post, How to instruction, Sales and marketing | Tagged , , , , , , | Leave a comment

How to Approach MapBusinessOnline Optimized Routing

MapBusinessOnline online mapping software includes an Optimized vehicle routing tool. You can access the tool by clicking the Route button on the far right of the Master Toolbar. You can also click the car icon on any plotted point on the map to start the routing process.

The routing capabilities of the MapBusinessOnline route tool are modest. They are designed for a traveling salesperson or a technician visiting clients. The routes are generally derived from an imported Excel file, or what we call a Marketing List.  Any data returned from a search query in MapBusinessOnline is called a Marketing List.

In addition to using MapBusinessOnline for sales planning, companies also use MapBusinessOnline Routing to manage field service staff. The Route tool lets a business map user or manager generate optimized routes for the personnel in the field. The field staff using MapBusinessOnline routes might be clinicians, technicians, or even plumbers. The business map service or sales users can also route for free using the MapBusinessOnline publicly shared maps. Learn more.

MapBusinessOnline clients use the Routing capability for a variety of actual applications, including:

  • Developing and sharing routing maps with any traveling associate.
  • Planning site visits in retail, homecare, or construction.
  • Generating turn-by-turn directions.
  • Estimating times and distances of a particular travel route for planning or expense purposes.
  • Creating school bus routing maps with critical drop-off/pick-up locations.

MapBusinessOnline Routing capabilities include:

  • Generating optimized routes that find the most efficient route across the road network. Stops can be arranged in order of presentation to the Route Window (as presented by a route marketing list of stops or an imported spreadsheet) or optimized for the most efficient vehicle route.
  • Creating routes with up to 150 stops – The tool allows up to 150 stops per route.
  • Time and date windows are supported. Learn more.
  • Route files can be exported for sharing as CSV, GPX, HTML, ITN, or PDF files.
  • Route stops can be added incrementally or grouped in the Data Window using the Add to Route toolbar.
  • Creating ‘route avoid’ intersections using the Draw or Search tools to create a polygon. Learn more.

Developing optimized routes in New England using MapBusinessOnline.

The Route tool in MapBusinessOnline does not support these functions:

  • It does not track vehicles in real-time or support live GPS tracking.
  • It does not allow for multiple vehicle routing or more than one route per map at a time.
  • The routing function does not access additional data columns in your imported data for analysis or export.
  • More than one route at a time. (The routing tool is limited to one route at a time per map.)
  • It does not provide stop numbering outside of the name field.
  • MapBusinessOnline does not offer large truck routing.

Manage Your Data Outside of the Route Tool

The real power of using the MapBusinessOnline optimized routing is derived through managing routing stops at the spreadsheet level. Arrange your stops and set up your naming conventions and data fields in Excel. Remember that your routing data is imported into the Data Window and then uploaded to the route Window for Routing purposes only.

MapBusinessOnline Standard is a $500 business mapping software with basic routing capabilities as an add-on. If you require route-related analysis, consider a tool like Route Smart.

MapBusinessOnline Pro includes a set of driving time and distance analysis tools that can provide analysis across multiple datasets. The Batch Calculate option is valuable as an origin-to-destination study for many data points – well beyond the 150 stops allowed by the Route Window. Consider MapBusinessOnline Pro for advanced transportation network analysis. Learn more about Pro.

Route segments can be selected, highlighting them in yellow & presenting relevant turn-by-turn directions.

Some Tips for Routing

Place ID Numbers in the Name Field – Some users like to number their traveling vehicles for internal analysis. MapBusinessOnline Routing has no flexible field to enable numbered labeling and reporting. We suggest placing the stop number in the name field of your spreadsheet.  For instance, under Stop Name: put ‘UPS Building – Stop 54.’ Use your imagination.

Saving a Route – MapBusinessOnline only allows one route on the map at a time. This generally means you must delete a route to start a new one. Here are a few options:

  • Export the route as a route file for future reference. Share as a CSV or GPX file.
  • Save the map you’re working on as a My Map file. To generate new routes, create a new map and save it with a different name from the original My Map. The map and route are then inextricably linked.

Turn-by-Turn Directions – Every route generated includes a turn-by-turn directions report. This report will provide distances and times between stops and the overall length and estimated time for the entire route. These route reports are PDF files ready for sharing.

What Does Optimize Mean?

Optimized routing means the business mapping application can decide which stop order returns the most efficient route for your vehicle. The application substitutes the optimized route for the original submitted route’s stop order. When the user selects the optimize option, the mapping software considers road speed limits, road classifications, one-way streets and two-way streets, and other road network characteristics in developing the route. Even historical traffic records are considered, which can help taper time estimates during commuting periods.

Routes can be requested as one-way or two-way. Two-way means to there and back again.

MapBusinessOnline routing is convenient for traveling business mapping users. At $500 for MapBusinessOnline Standard, it is a bargain for generating optimized routes, which is why many companies use the tool for route generation. Typical routine software services cost more than $5,000 for similar services, with a few more bells and whistles.

_______________________________________________

Discover why over 25,000 business users log into www.MapBusinessOnline.com for their business mapping software and advanced sales territory mapping solution. The best replacement for Microsoft MapPoint happens to be the most affordable.

To access MapBusinessOnline, please register and download the Map App from the website – https://www.mapbusinessonline.com/App-Download.aspx.

After installing the Map App, the MapBusinessOnline launch button will be in the Windows Start Menu or Mac Application folder. Find the MapBusinessOnline folder in the Start Menu scrollbar. Click the folder’s dropdown arrow and choose the MapBusinessOnline option.

The Map App includes the Map Viewer app for free non-subscriber map sharing.

Please read customer reviews or review us at Capterra or g2crowd.

Contact: Geoffrey Ives at geoffives@spatialteq.com or Jason Henderson at jhenderson@spatialteq.com.

Posted in Business Mapping Software blog post, How to instruction, Sales and marketing | Leave a comment

How to Identify ZIP Codes without a Territory Assignment

MapBusinessOnline provides America’s best sales territory management software. Thousands of business mapping users across North America use MapBusinessOnline territory management to:

  • Motivate and organize their sales efforts.
  • Manage field staff providing clients with repair services.
  • Develop franchise sales territories based on key demographic categories.
  • Build hierarchical territories supporting regions, divisions, and zones.
  • Generate map-based market analysis where territories define areas of success and point to new markets.

The software offers informative map visualizations of territories based on a preferred map layer – usually ZIP codes, city limits, counties, and states. The most popular alignment layer for territory construction is the ZIP code layer.

A nationwide territory map created using MapBusinessOnline.

Territories can be created manually by cursor-selecting, polygon-lassoing areas on the map, or filtering for specific ZIP codes. Learn more. The territory map creator can import territory spreadsheets for instantaneous territory creation. Once established, territories can be edited as required:

  • To correct errors – nobody’s perfect.
  • To add or delete territory areas.
  • To make a specific territory larger or smaller.
  • To switch ZIP codes for whatever reason.
  • To adjust fill color and border properties.
  • For label adjustments and data appends.

A few weeks back, a chatting user asked how to identify ZIP codes not assigned to a territory. This is a great question and deserving of more in-depth study.

ZIP Code Territories

Zip code-based territories in MapBusinessOnline follow the identical sequences for creation and editing as county, state, or other map alignment layer territories. So, you can apply what you learn in this article to counties and different territory assignment layers.

Once a territory map is created, a territory layer is presented in the Data Window view. The Territory layer, data dropdown, ZIP codes, and all other map layers are selected from the left side.

The problem of identifying ZIP codes not assigned to a territory can arise under various circumstances, including:

  • Running a business query – ZIP code searches are conducted to answer a customer question, and a territory name is required. Call center associates often look up ZIP codes.
  • Generating additional territories – New territories must be created from unassigned ZIP codes.
  • Sales and business analysis – Sales activity by ZIP code happens and necessitates a ZIP assignment to a territory.

Old School Visual Approaches

What are the options for finding unassigned ZIP codes not associated with a territory? First, there’s the age-old ‘look at the map’ approach. This is strictly a visual process. Zoom to the ZIP code and scan the map view for the associated territory. It’s old school, but it’s also pretty easy if the map is optimized and not too complex.

First, make sure your territory map is optimized for visual inspection. Keep the ZIP code layer turned on in Map and Data. Use Map and Data layer tools to make the ZIP code layer between 50% and 80% transparent. Adjust the ZIP code boundaries to a darker color for better visibility. Do the same optimization to the Territory layer, keeping the color and line thickness slightly different than the ZIP code layer for differentiation. Learn more about map optimization.

Keep other layers like States and Counties turned off or unfilled with color. There’s no need for additional distractions.

In the Search Map box in the upper left-hand corner of the application – above the Master Toolbar, enter the ZIP code number and click the Binocular icon to the right of the search box. The map view will zoom to the center of the ZIP code in question.  Pan back using your Navigation Scroll Bar in the upper right corner of the map, and you’ll eventually see the territory color bounds.

You won’t see any territory-related color except ZIP codes if the Territory is unassigned. Generally, a territory will show a territory color (referenced in the Map Legend) and a territory label. TIP – You can hold down the Control Key and click on the territory to retrieve a missing label. Sometimes labels get turned off.

Another visual approach is simply viewing an area and selecting a ZIP code on the map with your cursor. If the ZIP code is not assigned to a territory, it will show as selected, highlighted in Yellow. (You can configure the selection highlight color in Map and Data options.)

If the ZIP code is assigned to a territory, MapBusinessOnline will present the Select Geography option dialogue box that lets you choose between the ZIP code and the Territory. Bingo! Right there, you know it is assigned to a territory.

Use the Data Window

The Data Window presents a tabular view of all data within any MapBusinessOnline map. Click the Data Window button on the right side of the Master Toolbar to open the tabular view.

Select the Data Window Territory Layer on the left dropdown for territories based on a ZIP code map alignment layer. Click the mini-Data Window icon to open a specific territory and see all the assigned ZIP codes for that territory. You can use the Filter By Code search bar to look for a particular ZIP code.

The Data Window with the Filter by Code Search Bar.

Filter the ZIP Code Layer for Territories

Here’s our preferred search method for ZIP codes left unassigned by territory, using the Filter button.

First, realize you can focus your Filter operation by State. In the Map and Data Box, click the Filter Map option and select the states you prefer to focus on. This will limit the number of ZIP codes presented to just those states of interest.

  • Select the ZIP code layer in the Data Window view.
  • In the lower right, click the Choose Columns
  • On the left side of the data organizer, under
    General
    , find the Territory and Territory Count. Move the Territory and Territory Count options to the right side. This adds columns to the Data Window territory view.
  • Note: You can now Click the header on either Territory column to arrange the data in descending order. This view can be helpful.

Back in the Data Window, the Filter function is accessed through the Filter and Search section. Click the Filter icon (a funnel.)  This opens a dialogue with access to MapBusinessOnline imported, demographic, and geographic data on the left. And with access to modifiers and value inputs on the right. 

  • Click the filter button. Select Territory or Territory Count. Choose the < Less Than modifier and click Filter.

The results will display all ZIP codes without a territory assignment.

If your territory map covers only a few states, you can see why the State filter can help. Without it, you’ll be wading through 47 states of ZIP codes. Use the Data Window toolbar’s Filter by Code box to quickly search for the ZIP code most important to you.

The approaches described above are ways to use a business map to search for any location data. ZIP codes are commonly used, but you might be looking for counties, Census tracts, or some other element in your imported location data. Play with the filter button options to get familiar with the filtering process in MapBusinessOnline. Sooner or later, you’ll be looking for something, and these Filter functions may be your best approach. Learn more.

_______________________________________________

Discover why over 25,000 business users log into www.MapBusinessOnline.com for their business mapping software and advanced sales territory mapping solution. The best replacement for Microsoft MapPoint happens to be the most affordable.

To access MapBusinessOnline, please register and download the Map App from the website – https://www.mapbusinessonline.com/App-Download.aspx.

After installing the Map App, the MapBusinessOnline launch button will be in the Windows Start Menu or Mac Application folder. Find the MapBusinessOnline folder in the Start Menu scrollbar. Click the folder’s dropdown arrow and choose the MapBusinessOnline option.

The Map App includes the Map Viewer app for free non-subscriber map sharing.

Please read customer reviews or review us at Capterra or g2crowd.

Contact: Geoffrey Ives at geoffives@spatialteq.com or Jason Henderson at jhenderson@spatialteq.com.

Posted in Business Mapping Software blog post, How to instruction, Sales and marketing | Tagged , , , | Leave a comment

Increase Business Intelligence through Proximity Analysis – MapBusinessOnline Pro

MapBusinessOnline Pro answers proximity questions for businesspeople who manage data – lots of data. Pro is used by transportation companies, banks, large retailers, insurance companies, and healthcare organizations, to name a few industries.

MapBusinessOnline Pro allows map creators to import up to 250,000 location records per map. Location records are generally business addresses but could be latitude and longitude coordinates. Learn more.

Proximity analysis enables an assessment of the location data surrounding a specific point, a set of points, or an area on the Earth. One could also think of proximity analysis as a critical tool for situational awareness. Proximity analysis and spatial searches enhance business intelligence leading to healthier growth, more market share, and a more attractive bottom line.

Best Potential New Market Areas Circled for More Research.

In MapBusinessOnline Standard, proximity analysis gathers all of the records within a specified radius or driving distance/time of a given central point. In MapBusinessOnline Pro, map users can extend proximity analysis by reporting on the distances (straight line or driving distance) from Point A to a set of points B(x)to B(y). The added benefit for MapBusinessOnline Pro users is the software’s ability to calculate driving distances and driving times along a road network. You map creators will look long and hard for a cloud-based mapping software that conducts driving time and distance queries for less than $1000.00. Let me know if you find one.

Radius searches applied to a business map are typically set to a specific radius to capture all of the location data within that radius-defined circle. For example, a business map user could specify a ten-mile radius, drop a central point on the map with their mouse cursor and query the map for data. Examples of queried data vary depending on the industry of the subscriber but could include:

  • All homes for sale within ten miles.
  • All medical facilities within ten miles.
  • All customers within ten miles.
  • All prospects within ten miles.
  • All bowling alleys within ten miles.

The possible location targets are endless. Download additional data sets using MapBusinessOnline Business Listings for a small fee.

MapBusinessOnline Pro

Proximity analysis in MapBusinessOnline Pro enables a whole new array of proximity search features. Pro introduces the ability to compare two datasets of points and calculate the distance between all points in both data sets. These calculations generate three levels of proximity:

  • Straight line distance – as the crow flies from Point A1 to Point B1.
  • Driving distance – the distance driven across a road network.
  • Driving times – The time it takes to drive the distance across the road network.

MapBusinessOnline Pro features are located in the Market Analysis button along the master toolbar. Proximity Analysis results vary from function to function.

Driving Time Polygons Created Using MapBusinessOnline Pro.

Search & Segment Data – Create marketing lists by searching all points in a dataset based on a selected radius, reporting the results for each radius in either Straight distance, Driving Distance, or Driving Time. Instead of marketing lists, the map creator could request that territories be created from map layers.

This function is excellent for organizing lists of proximity results arranged by distance or time from each point.  A practical example would be delivery planning, where the number of stops in a 10-mile radius could represent a full truckload.

Batch Calculate Distances or Times Between One or Two Datasets – With this proximity query, a map user can analyze all distances between all points – straight, driving, or time – and collect the results for totaling.

Users apply this calculation to transportation systems to assess maximum systems costs or delivery time estimates given a set of addresses. Many users use this tool to conduct ZIP-code to ZIP-code analysis to gauge the efficiency of a transportation network.

Find the Nearest – Another perspective on Proximity analysis is finding the nearest locations from one set of data to another set of locations. At the risk of sounding redundant, we’re looking for the closest twenty locations. In MapBusinessOnline instructions, we tend to use Customers to Store as the classic example. So the result would be a set of up to twenty stores nearest to a dataset of customers.

It could go the other way, too, to find the nearest twenty customers to this set of stores. All results can measure Straight, Driving Distance, or Driving Time. You can set a maximum distance or time as well.

Find the Nearest results will add a column to the relevant datasets in the Data Window. You’ll have the opportunity to add a little bit of defining text for the heading, which will also display Driving Distance or which analysis you chose to apply

Other examples of how this query is used in the field:

  • Finding the nearest hospitals or emergency centers. Especially interesting in times of high traffic, which can impact the calculation.
  • Find the nearest ATM – There are many reasons why the nearest cash machine might be essential to a process – some good, some bad.
  • Find the nearest automobile inspection station – A tribute to Willbur Holmes, VP of Sales at Holmes Distributors in Portland, ME. Wilbur regularly scanned the parking lot with binoculars from his office to determine which employees had expired or were close to expiring registration or inspection stickers. Wilbur would then notify you of your faux pas, avoiding inevitable incarceration for semi-innocent people.

A growing number of businesses are taking seriously the study of location data and proximity analysis. Realize the power that location analysis, driving time and distance calculations, and map visualizations can add to your business intelligence. Join the party. Get the power. Purchase or upgrade to MapBusinessOnline Pro.

Read more about the difference between MapBusinessOnline Standard and Pro.

_______________________________________________

Discover why over 25,000 business users log into www.MapBusinessOnline.com for their business mapping software and advanced sales territory mapping solution. The best replacement for Microsoft MapPoint happens to be the most affordable.

To access MapBusinessOnline, please register and download the Map App from the website – https://www.mapbusinessonline.com/App-Download.aspx.

After installing the Map App, the MapBusinessOnline launch button will be in the Windows Start Menu or Mac Application folder. Find the MapBusinessOnline folder in the Start Menu scrollbar. Click the folder’s dropdown arrow and choose the MapBusinessOnline option.

The Map App includes the Map Viewer app for free non-subscriber map sharing.

Please read customer reviews or review us at Capterra or g2crowd.

Contact: Geoffrey Ives at geoffives@spatialteq.com or Jason Henderson at jhenderson@spatialteq.com.

Posted in Business Mapping Software blog post, How to instruction, Sales and marketing | Tagged , , , , , , | Leave a comment

How do I Optimize and Generate Map Images Using MapBusinessOnline?

A map visualization is a map-based image depicting a business situation. We sometimes refer to business maps as map visualizations. A map visualization is a map-based image showing a business situation. Due to the nature of our work here at MapBusinessOnline, we have much experience creating map visualizations.

These business map visualizations we create are primarily used to generate map images for use on our website or for business presentations.

MapBusinessOnline provides users with several ways to capture a completed map image:

  • Export Image is a button located on the right side of the Master Toolbar. This image option will create a Jpeg or PNG file type out of the entire map extent image, which then can be saved to your desktop. Jpegs are smaller files. I prefer PNG files in places where file size is not an issue.
  • The Print button on the Master Toolbar includes options for saving the map view as a large-format PDF file. These files can be enormous in both actual print (up to 5 ft. x 5 ft.) and digital file sizes. PDF files are used to generate paper wall maps. Learn more.

A map user can also apply the Windows Snippet tool to grab images from the business mapping platform. The main advantage of using a Snippet image grab is that it can capture the Data Window and other map function views at the same time. I keep a launch button for the Sippet tool on my Windows 10 taskbar.

An Apple user has a similar image-grabbing tool called Screenshot that can generate images in Jpeg, PNG, and PDF formats.

A retail site selection map using MapBusinessOnline.

Preparing for Business Map Creation

Map creation takes time, especially at first. Business mapping software users should expect to experience a learning curve on the way to achieving mature map-making status. While MapBusinessOnline tools are, in fact, easy-to-use, optimum map visualizations are derived from experience and require thought and patience.

A significant first step is to seek to clearly understand why you are creating a business map. Collect the relevant location data available – ensure that the data you use is pertinent to your map’s mission and that sharing the data is permissible.

Business maps should be kept simple and focused. As a rule, do not try to solve multiple problems with one business map.

The Map and Data Box

The gray Map and Data box hovers over your map. Its main face includes the checkbox for all your map layers and data layers. Explore the Map Options button for controls over Map Title, the Map Legend, and the background color. Drill down into each map layer to explore the map editing tools for the map look and feel available for your map optimization.

Those tools include boundary controls, transparency controls, fill color controls and labeling tools. Learn more.

Keep the below maxims in mind as you create your map images:

  • Images are cheap – You may think your map is complete, but after generating a final image, look it over to determine if it meets proper mapping standards. Are there distracting map objects (circles, polygons, lines) or extra text on the map? If there are, delete the extra objects and clean up the map.
  • Map Purpose – Is your business map’s purpose clearly stated? Maps are supposed to be informative, not a game. Don’t make your map audience guess what the map is about. They have better things to do.
  • Avoid map clutter – Same as above, except ‘map clutter’ deserves its own maxim. Map clutter hides or detracts from your map’s purpose. Map clutter can be map objects that add no value, datasets imported to the map that serves no purpose, or labels on states, counties, or ZIP codes that do not need to be turned on. If you created this map from another business map or map template, be vigilant in removing redundant data.
  • Boundary Lines – Most maps appear better with solid and dark boundaries. MapBusinessOnline makes it easy to adjust color and thickness on borders. That said, only include layers with boundaries if they add value to the map. States usually add value because they are orientating for the map viewer. Counties, not so much.
  • Be Miserly with Text– Maps tell a story. Included text should be part of that story. Focus on map communication. Too much text will put map viewers to sleep. In presentations, superfluous text risks distracting questions. As Obi-Wan Kenobi says, “Use the map, Luke.”
  • Demographic Data Supports Certain Business Analysis – Not all B2B analysis requires demographic data and thematic mapping. Make sure your map benefits from demographic themes before including them. Usually, demographic categories such as population, income, age, and gender can aid map analysis. Make sure your use of demographics is relevant to the map’s purpose.
  • ZIP code and County labels – Labels in mapping are tricky. Turning on all ZIP code labels at a nationally zoomed USA view is a recipe for map confusion. Business mapping tools are designed to accommodate label challenges. Label controls in MapBusinessOnline can help. Large and tall states like Texas and California can be problematic due to the inherent landscape configuration of the map view. Texas and California are tall and large, making details like county and ZIP code labels challenging to squeeze in. Learn more.

Cluttered or informative? The Map Creator decides.

Double Check Your Work

Working with business maps is exciting. Today’s business mapping applications are cloud-based and made for the mapping novice. Business mapping does not require a GIS degree. Still, don’t get carried away.  Keep your map audience in mind as you create your business map. Below is a checklist of double-check items for your map work.

  • Check your spelling – Map applications don’t have spell checkers. Be careful. A beautiful business map could net you an A+. Misspellings will bring down your grade in the minds of your associates.
  • Consider a Map Title – MapBusinessOnline provides a map title box in Map and Data under Map Options. Check the box associated with Show Map Title.
  • Edit the Map Legend – The legend automatically picks up all data and map layers. Edit the presence of each layer – you may not need to display a map layer name in the legend. Consolidate text where possible. All map legend text should add value.
  • Consider turning off map controls – Shut down Map and Data and the Master Toolbar before you save your final image. Notice the tiny black down arrow just above the Map Layer button on the Master Toolbar. Click that to turn off the toolbar.
  • Adjust your Zoom settings – Is the map zoomed in far enough or too far? Try different zoom settings to optimize your map view.
  • Get a second opinion – Have a trusted associate look at your map before you make a final save. A second set of eyes can sometimes stave off disaster.

Creating business maps for your executive team is an exciting way to get noticed in your organization. If you do not get asked to make any more maps after a presentation or strategic meeting, it will be because your map didn’t add value to the discussion.

The tools and tips above will help you create sales territory maps, strategic maps, and franchise maps, that add value to your business discussions. Carefully designed maps are career-enhancing. Hastily generated map images that do not efficiently communicate are career-limiting. Choose wisely, Luke – “The force has a strong influence on the weak-minded.” – Obi-Wan Kenobi.

_______________________________________________

Discover why over 25,000 business users log into www.MapBusinessOnline.com for their business mapping software and advanced sales territory mapping solution. The best replacement for Microsoft MapPoint happens to be the most affordable.

To access MapBusinessOnline, please register and download the Map App from the website – https://www.mapbusinessonline.com/App-Download.aspx.

After installing the Map App, the MapBusinessOnline launch button will be in the Windows Start Menu or Mac Application folder. Find the MapBusinessOnline folder in the Start Menu scrollbar. Click the folder’s dropdown arrow and choose the MapBusinessOnline option.

The Map App includes the Map Viewer app for free non-subscriber map sharing.

Please read customer reviews or review us at Capterra or g2crowd.

Contact: Geoffrey Ives at geoffives@spatialteq.com or Jason Henderson at jhenderson@spatialteq.com.

Posted in Business Mapping Software blog post, How to instruction, Sales and marketing | Tagged , , , , , , , | Leave a comment

How to Conduct a Radius Search Using MapBusinessOnline

In MapBusinessOnline, we refer to a circular spatial search as a radius search. There’s no need to understand algebraic or geometric formulas that use Greek letters.  (WordPress will not accept Greek letters, so I can’t use pie-r-squared. Boo! Hiss!)

A radius search within the MapBusinessOnline business mapping platform can provide results for various queries. A radius search places a circle shape on the map. This is the process to create a Radius object:

  1. Under Search Tools on the Master Toolbar, select the Circle option.
  2. Place the Circle center point on the map – any place you desire.
  3. In the dialogue box that pops up, input the required radius miles.
  4. Click Search Data.
  5. Now, you have a choice. You can search any of the presented data fields for spatial search results. Or you can close the map layer search box and continue placing a Circle map object on the map.

Placing a plain old circle on the map provides a way to highlight an area, address, or zone on your business map.  To draw a map viewer’s attention to an area. Map creators use Radius Searches for other purposes, including:

  • Conduct a quick radius search of an area for associated demographic data. Learn more.
  • Segment an imported address list of customers or prospects for sales planning and marketing activities.
  • Conduct preparatory work for sales territory creation, generating a few 25-mile radius territories around a city center or facility.
  • Search MapBusinessOnline for business listings by area, industry, or business name.

Search for Data

Any MapBusinessOnline map layer can be radius searched and will present the results in the Data Window. The data window search results can be exported, filtered, routed on, and color-coded on the map. You could also use the map layer search results to create a territory.

Applications for radius searches are many. At its most basic, a circle placed on a business map can be a placeholder, a highlighted area the map creator wants their audience to pay more attention to.

A plain old circle on the map can be filled with any rainbow color. Tools associated with the circle pop up when the object is selected. Feel free to color the circle and adjust the transparency toolbar for a more transparent experience. Thicken and color the circle boundaries as well.

Often circle placements repeat, as the map creator may need to highlight multiple circles on the map. To repeat, re-click the circle icon on the Master Toolbar and drop another point on the map. The map creator can color the various circle fills and boundaries with different colors or the same colors. Boundary thicknesses and colors can also be adjusted.

Repeated circle maps can be used to depict coverage areas around service providers. I’ve seen multiple circle objects used to show coverage areas for health insurance organizations, home care agencies, sales organizations, and retail chains.

This circle-in-a-circle or concentric circle approach is excellent for creating delivery or service zones from a central location. Concentric circles are generated from the same center point. Learn more.

Circles within Circles Constitute Concentric Circle Maps.

Query Demographic, Geographic, and Imported Data

As mentioned in Step 5 of the plot-a-circle process described above, a map user can query the circle area for any of the possible datasets provided by MapBusinessOnline. This is, in essence, a spatial query where the spatial aspect is the area bounded by the circle. Possible data layers available for querying include:

  • Imported location data – Data the map creator has imported. Usually, sales figures, customer addresses, or critical resources.
  • Map layer objects – MapBusinessOnline geographies such as ZIP codes, Census Tracts, city limits, counties, Metropolitan Statistical Areas, states, and territories.
  • Census demographic data – Accessed through the Summarize button, described below.

You should find it easy and intuitive to search for, save and export a dataset in MapBusinessOnline. Queried or searched data layers can be saved as Marketing Lists in the Data Window for further work and export. The Export button is located on the far right of the Data Window Toolbar.

Please note that MapBusinessOnline provides several additional options in the Radius Search dialogue windows:

  • A checkbox to find the nearest 100 records (1st page.)
  • A checkbox to invert the search – which means search outside the circle – (2nd page.)
  • Options for updating the marketing lists are noted on the left of the dialogue page – (2nd page.)

Query Demographic Data

The map creator can query data with any selected map object or, in this article’s case, a circle.  As noted above, use the Search option in the map object’s associated menu to query geographic and imported data. But to query demographic data related to the circle area, use the Summarize Option in the associated menu.

  1. Click the Summarize button.
  2. The second dialogue page presents a drop-down above two columns. Select demographic data on the Left, scroll down through the library of demographic categories, and choose up to ten subjects.
  3. Move the desired objects to the Right column.
  4. Click Next and notice the options for demographic data disposal – Add to the Map or Export.

Currently, the most recent year’s demographic data is a third-party projection. The other years listed are Census Bureau ACS releases. Remember, all demographic data totals are estimates.

MapBusinessOnline Pro Radius Searches

MapBusinessOnline Pro expands the use of multiple radii searches by allowing the user to conduct multiple searches in one pass. This function is listed under the Analysis button on the Master Toolbar.

  1. Click the Analysis button and select the top option labeled Search and Segment Data from Multiple Centers.
  2. The second dialogue page provides options for Straight Distance, Driving Time, or Driving Distance radius measures. An option for creating multiple radius circles around up to 200 center points is also presented. Click Next.
  3. Choose the data layer to search in the Search Data dialogue. Note the Checkbox at the bottom providing the option to create:
    1. Multiple territories in one pass if you select a map layer.
    2. Multiple Marketing Lists if you select a dataset layer.
  4. Click Create.

Draw Tools vs. Search Tools

To the right of Search Tools on the Master Toolbar are the Draw Tools. These tools provide the same map objects on the map as the Search Tools. The Search Tools offer a more direct path to search for data inside the placed radius search.

A radius search or radius map provides one of several spatial forms for highlighting an area or searching for data. These tools are not complex, but they are powerful. Great minds like Caesar, Napoleon, Joan of Arc, and even Groucho Marx would have all found uses for radius maps.  “Veni, vidi, radii,” and “Excuse me, lady, aren’t you new to this circle?”

_______________________________________________

Discover why over 25,000 business users log into www.MapBusinessOnline.com for their business mapping software and advanced sales territory mapping solution. The best replacement for Microsoft MapPoint happens to be the most affordable.

To access MapBusinessOnline, please register and download the Map App from the website – https://www.mapbusinessonline.com/App-Download.aspx.

After installing the Map App, the MapBusinessOnline launch button will be in the Windows Start Menu or Mac Application folder. Find the MapBusinessOnline folder in the Start Menu scrollbar. Click the folder’s dropdown arrow and choose the MapBusinessOnline option.

The Map App includes the Map Viewer app for free non-subscriber map sharing.

Please read customer reviews or review us at Capterra or g2crowd.

Contact: Geoffrey Ives at geoffives@spatialteq.com or Jason Henderson at jhenderson@spatialteq.com.

Posted in Business Mapping Software blog post, How to instruction, Sales and marketing | Tagged , , , | Leave a comment

MapBusinessOnline – Solving Problems You Never Knew You Had

One remarkable aspect of MapBusinessOnline and business mapping software, in general, is the array of options the map user can select to solve a business problem.

Business mapping software solves business problems associated with location data. Connecting business sales data with demographic and geographic data through map visualizations informs decision-making and encourages growth and efficiencies.

Our Distracted Lives

I understand that, to a first-time user, all these business mapping choices can feel overwhelming. Especially when coupled with the rest of our day. Let’s face it; humanity has beset itself with incessant tech demands for our attention and decisions – all day, every day:

  • Changing passwords.
  • Security codes sent to your phone.
  • Spamming emails, you need to sort through and delete.
  • Spamming phone calls.
  • Subscription renewal reminders.
  • Anti-virus warnings.
  • Dell, HP, and Apple notifications.
  • Microsoft Windows updates.
  • Special offers.
  • Political donation solicitations.
  • Pharmacy prescription renewals.
  • Credit card alerts.
  • Bank transaction notifications.
  • Software update reminders.
  • Your Mom is calling for help finding her cable station.
  • Social media notifications.
  • Software you didn’t know you had notifications.
  • Mother-in-law notifications.
  • Birthday reminders.
  • LinkedIn connection requests.
  • Appointment reminders.
  • And, my favorite, your mom called again because your dad is on the phone with some guy with an accent from the Internet who is demanding a credit card number to release Dad’s computer from prison.

The list goes on, and it’s maddening. Add to this Christmas time a national election, a pandemic, or a significant winter storm, and you might as well take the rest of the year off. Oh yeah, and let’s not forget what happens today whenever a 95-year-old celebrity kicks the bucket. Stop the presses! Circle the wagons! Alert the authorities! Betty White died of natural causes.

But I digress. Now, where was I?

MapBusinessOnline, despite all the interruptions, offers geographic and demographic solutions to business problems. Problems a map user may not even realize they have.

Sales Forecasting Presentations

Sales and marketing professionals are tasked with developing sales forecasts, often presenting and justifying these forecasts in a meeting with the executive team. Certainly, spreadsheets will be part of this process, but giving spreadsheets and numbers in a PowerPoint presentation to the executive team can be risky. Some of the team will be bored and distracted. Others will have trouble believing how the forecast rolls up into territories from individual salespeople.

The risk is if you leave them wondering whether or not the forecast is accurate, your future with the company is in doubt.

MapBusinessOnline sales territory management tools combine the power of spreadsheet columns and data summarizations with compelling map visualizations. Your spreadsheet probably lists each account with the previous year’s sales numbers. Imported as an address spreadsheet into MapBusinessOnline, this same sales data will sum by address and territory and roll up nicely into regions and divisions. MapBusinessOnline calls these hierarchical territories.

I suggest using MapBusinessOnline live or image slides within a sales forecast presentation. These on-map sales account forecasts can be arranged to show forecast vs. actual or previous years vs. current year. Territory areas can be color-coded to reflect progress against goals or comparisons to last year.

Client-by-client forecast records could be visualized as address points on the map with associated sales activity and projected numbers added to labels. Client location address datasets can be included in the forecasting map but turned off – there for reference and discussion if questions arise.

MapBusinessOnline Used to Create a Sales Forecast Map

In response to questions from the executive team, client details can be instantly turned on to reveal real numbers supporting the total forecast. No presentation can answer every question. But by presenting an organized map-based forecast with backup for projected numbers, you will have gained the confidence of your higher-ups and can always follow up later with more details. Remember: Follow-up completed shows you are reliable.

A powerful element of business mapping software stems from the fact that humans have an affinity for maps. A well-crafted business map quickly informs the map audience. Combined with accurate spreadsheets, business maps instill a sense of trust and professionalism in any presentation of location data. And if you are associated with a solid presentation, that bodes well for your future.


Using a Sales Territory Map for a Presentation.

Segmenting Marketing Lists

In MapBusinessOnline, when you import a list of customer addresses, those ‘points’ appear on the map, ripe for color-coding and symbolizing. But those imported numbers appear in tabular or spreadsheet format in the Data Window view.

The Data Window view of your imported data is called a Marketing List by MapBusinessOnline. Within the Data Window view, you can filter any marketing list in various ways to accommodate business activities or analyses. You could, for instance:

  • Move the extent of the Data Window itself to contain your preferred segment of the entire list, and then save that segmented view as a new Marketing List for analysis, routing, or export.
  • Cursor-select a section of the list which will then highlight in yellow. Once again, save the list for other operations.
  • Filter the list by any column of data using the Funnel filter icon on the Data Window toolbar. Example filters might be to find all filtered records in this set of ZIP codes, filter all records with a population greater than X, or perhaps filter for all territory names that include the letters ‘ton.’

In the map view, you can also apply spatial filtering or queries to marketing lists. For instance, you could:

  • Filter a whole imported dataset by applying a Radius, Polygon, or Drive Time search. Save the data results as a new marketing list.
  • Filter imported business listings datasets by ZIP code, city limit, county, or territory. Once again, save it as a marketing list.
  • Look to the Map and Data box to filter the data visually by State.

Marketing lists are filterable. This makes segmented business operations possible. So instead of routing on all points, you can route on a segmented group of points selected based on filter criteria.  Your travel routes could be developed based on proximity to a sales representative’s home address.

At any rate, filtering and data segmentation help you solve problems in multiple situations:

  • Analysis – Limit your map view to certain areas. Conduct ZIP code – to ZIP code analysis. For instance, filter marketing lists by ZIP code and then apply demographic categories to your analysis.
  • Routing – Route your technicians, salespeople, or clinicians to segmented lists of contacts by address – up to 150 stops per route. Just click the Add to Route button on the Data Window toolbar.
  • Logistics – Conduct batch calculations across 1,000 origin points vs. 1,000 destination points. Estimate travel times, distances, and expenses. Conduct ZIP code – to ZIP code analysis.

MapBusinessOnline – solving problems you didn’t realize you had.

Adding Demographic or Geographic Data to a Spreadsheet

Until the boss asked you for this information, you didn’t think you had this problem. She’s got a spreadsheet with your vendor addresses on it, but the vendor needs the ZIP codes and recently associated population totals added to the data.

Using MapBusinessOnline Pro, you can import location data into a Data Window view and use the Enrich a Dataset option under Analysis on the Master Toolbar to supplement that data with demographic or geographic categories. Export to CSV for use outside of the application.

This particular problem doesn’t happen every day. But when it does, the Enrich a Dataset tool is an easy way to get at geographic and demographic data in one pass.

The above examples are just a few business problems MapBusinessOnline can help solve. Unfortunately, we haven’t figured out how to keep grandparents off the Internet. My dad did well with computers in his twilight years until he watered his laptop. They dry out so quickly, you know.

_______________________________________________

Discover why over 25,000 business users log into www.MapBusinessOnline.com for their business mapping software and advanced sales territory mapping solution. The best replacement for Microsoft MapPoint happens to be the most affordable.

To access MapBusinessOnline, please register and download the Map App from the website – https://www.mapbusinessonline.com/App-Download.aspx.

After installing the Map App, the MapBusinessOnline launch button will be in the Windows Start Menu or Mac Application folder. Find the MapBusinessOnline folder in the Start Menu scrollbar. Click the folder’s dropdown arrow and choose the MapBusinessOnline option.

The Map App includes the Map Viewer app for free non-subscriber map sharing.

Please read customer reviews or review us at Capterra or g2crowd.

Contact: Geoffrey Ives at geoffives@spatialteq.com or Jason Henderson at jhenderson@spatialteq.com.

Posted in Business Mapping Software blog post, Sales and marketing | Tagged , , , , , , , | Leave a comment

Business Maps & Market Analysis – Together Forever

How can a business mapping software application claim to provide market analysis? Fair question. I believe one of the primary reasons business mapping is helpful in analyzing markets is that markets are commonly associated with physical areas of the world, local or worldwide.

Developing Market Area Profiles Using MapBusinessOnline.

Ancient History of Market Analysis

Examples of markets identified with sections of the Earth abound. Picture, if you will, some of the early markets at the dawn of civilization. Along the Tigris and Euphrates River valleys, wheat and other crops had become attractive to the surrounding hunter-gatherer tribes. As more and more people traded for wheat or began cultivating produce themselves, markets sprang up.

Pretty soon humankind’s first cities and towns took root around these early agricultural harvest marketplaces. As the marketplace was expan,ded other products also started to appear in these early shopping plazas– clothing, early booze, and early Emma Eames recordings.

As cities and towns spread across the middle east and into Europe and Asia, markets went with them. Trade flourished along routes between major cities and, eventually, empires and nations. As the civilized world expanded, products were moved over thousands of miles to satiate demand in faraway places.

Later came the age of seaborne exploration. If my high school social studies classes serve me right, gold and spices were the significant drivers of exploration—hot imported products from the New World and the money to pay for their transport to the Old World. And at that time, as the age of exploration took hold, accurate maps became extremely valuable purveyors of information. Of course, ‘accurate’ back then was a relative term.

An ‘accurate’ map of the world circa 1489.

So, maps frtheeir very beginning were very focused on markets. Much like they are today. And when you load up maps with product locations, sources for gold and silver, and transportation routes, it’s not a stretch to call the study of those subjects – analysis.

Map-based Market Analysis Today

Examples of industries that use market analysis maps today include banking, franchising, insurance, law enforcement, real estate, retail, restaurants, sales & marketing, and a whole host of service businesses. All these industries were in their infancy in Sumaria, Mesopotamia, and Babylon. Ask any archaeologist. They really did have insurance back then.

Today, business maps provide even more accurate and easy-to-use cartographic representations of the world’s marketplaces. MapBusinessOnline is focused on North America – for now, anyway.

The current USA marketplace is quite complex. Fortunately, governments and businesses have worked together over the centuries to create jurisdictions that provide physical areas for organizing markets.  ZIP code, county, and city boundaries serve as fantastic marketplace identifiers. These same jurisdictions provide laws and rules that enhance and police commerce so that chaos does not disrupt the flow of goods and services. Although, from time to time, chaos does creep in. Think early Pandemic 2020, September 11, 2001, and Filenes Basement in Boston in the 1970s.

MapBusinessOnline relies on boundary sets such as ZIP codes and City Limits for its geographic structure supporting map-based market analysis. These government and postal service-assigned geographies are matched geographically by the US Census Bureau, which uses these areas for demographic segmentation.

The practical result of this symbiotic digital partnership between government and commerce is that a business map user can identify areas where marketplaces exist, products are sold, and analyze these areas for their demographic attributes. Business subscribers to MapBusinessOnline can overlay their sales activity and customer locations on top of accurate digital maps through easy spreadsheet imports.

MapBusinessOnline market analysis is more than informative – it’s darn-right powerful. Through this analysis, market trends and patterns become apparent. These marketplace revelations include:

  • Defining the demographic segments that support your products or services.
  • Determining which geographic areas contain the resources that will support and encourage future growth.
  • Identifying the ZIP codes or cities that spatially define your best-performing marketplaces.
  • Helping to determine the best new marketplaces to test for future growth.

The power of business mapping market analysis is the ability to profile a ZIP code or city based on your product sales and uncover untried ZIP codes or cities in other parts of the country that match your best original profile.

A ZIP code or city profile will include business sales data and, in consumer-focused businesses, demographic data. But ZIP code profiles might also include competing businesses, critical resources supporting your industry, labor statistics, tax rates, and more. I think you get the picture.

So, while New York City markets are certainly more complicated than downtown Uruk, Sumer, 5000 years B.C., technology has kept up with the situation. Business mapping and map-based market analysis will carry your business forward toward future markets and continued growth for another 5,000 years. Don’t forget to renew.

_______________________________________________

Discover why over 25,000 business users log into www.MapBusinessOnline.com for their business mapping software and advanced sales territory mapping solution. The best replacement for Microsoft MapPoint happens to be the most affordable.

To access MapBusinessOnline, please register and download the Map App from the website – https://www.mapbusinessonline.com/App-Download.aspx.

After installing the Map App, the MapBusinessOnline launch button will be in the Windows Start Menu or Mac Application folder. Find the MapBusinessOnline folder in the Start Menu scrollbar. Click the folder’s dropdown arrow and choose the MapBusinessOnline option.

The Map App includes the Map Viewer app for free non-subscriber map sharing.

Please read customer reviews or review us at Capterra or g2crowd.

Contact: Geoffrey Ives at geoffives@spatialteq.com or Jason Henderson at jhenderson@spatialteq.com.

Posted in Business Mapping Software blog post, Sales and marketing | Leave a comment

How is MapBusinessOnline Used for Sales Planning?

Sales professionals use map-based customer tracking tools like MapBusinessOnline to monitor customer activity, plan sales trips, and expose geographic patterns from sales and customer data. MapBusinessOnline provides a set of twelve features and functions that enhance a salesperson’s ability to visualize their sales territory and effectively manage the customers and prospects distributed across their assigned areas.

Nation-wide Sales Territory Mapping Developed Using MapBusinessOnline.

Those MapBusinessOnline functions that specifically address sales professionals include:

  1. Customer Map Visualizations – Import address spreadsheets of customers and prospects, color-coded for fast identification. Arrange and symbolize your imported data to reflect sales revenue, visit dates, or other relevant data. Conduct spatial searches.
  2. Sales Territory Mapping – Shared or individually created territories that define a salesperson’s area of accountability, focusing their activities on company goals and objectives. Import territory spreadsheets or create territories from scratch using ZIP Codes, City Limits, Counties, or States.
  3. Business Listing Searches – Identify, access, and plot prospective customers or competing businesses. MapBusinessOnline business listings include firmographics and critical contact information.
  4. Optimized Vehicle Routing – Create optimized routes for salespeople traveling from home or office to as many as 150 stops. Supports round trips or one-ways, time windows, and provides time and mileage estimates. Routes are exportable as GPX or CSV files and easily opened from
    within Excel.
  5. Market Analysis – Compare actual sales activity to sales potential. Build ZIP codes profiles from actual sales results and demographic analysis for sales expansion planning. Find the USA cities that best match your product’s demographic sweet spot.
  6. Estimate Sales Team Travel Expenses – Conduct driving time and distance analysis from start-of-day locations to customer lists. Great for any mobile support team.
  7. Shared Sales Objectives & Progress Against Goals – MapBusinessOnline sales territory mapping tools are a great way to present sales results in a sales meeting or through online shared maps. Conduct a live session or let salespeople view the results on their own time.
  8. Conduct Demographic Analysis – Overlay imported customer sales data over demographic heat maps of your business’s areas of interest—append labels with demographic data or export demographic information.
  9. Franchise Territory Maps – Easy-to-use sales territory maps are perfect for franchise organizations. Use sales territories as marketing collateral. Develop franchise territory segmentation based on demographics or other criteria. Attach maps and datasheets to franchise ownership documentation.
  10. Sales Tracking Platform – Business map users often become so used to geographic visualizations of customers and prospects that MapBusinessOnline becomes their defacto CRM tool. Establish individual maps by region to cover specific customers with specific driving times. This sort of customer territory view is especially helpful to salespeople who frequently travel for face-to-face meetings.
  11. Driving Time and Distance Querys – Driving time assessments help establish sales territory scope and inform logistics planning. Driving time zones are often used to develop delivery charges. MapBusinessOnline Pro includes advanced driving time and distance analysis.
  12. Heat Mapping – Color-code your ZIP codes, counties, cities, or territories based on your sales numbers or sales and marketing activity.

A Sales Organization Map Visualization.

MapBusinessOnline Standard provides all the essential sales-related business mapping tools for sales planning, logistics, and territory management. Consider MapBusinessOnline Pro for advanced market analysis, driving time and distance queries across multiple center points and multiple datasets.

  • MapBusinessOnline Pro provides the most significant location data import allowance – up to 250,000 records. (Standard – 50,000.)
  • MapBusinessOnline Pro allows up to 1000 territories. (Standard – 50.)
  • MapBusinessOnline Pro includes all the functionality of MapBusinessOnline Standard.

Finally, replace that tattered copy of Microsoft MapPoint. What company that you respect uses ten-year-old software? Get with the cloud program…

MapBusinessOnline – Affordable yet advanced business mapping tools – designed to maximize your business benefit from geographic analysis and map visualizations without requiring degreed experts, consultants, or new bodies. (We hate those guys.)

Contact MapBusinessOnline for a web demo today.

_______________________________________________

Discover why over 25,000 business users log into www.MapBusinessOnline.com for their business mapping software and advanced sales territory mapping solution. The best replacement for Microsoft MapPoint happens to be the most affordable.

To access MapBusinessOnline, please register and download the Map App from the website – https://www.mapbusinessonline.com/App-Download.aspx.

After installing the Map App, the MapBusinessOnline launch button will be in the Windows Start Menu or Mac Application folder. Find the MapBusinessOnline folder in the Start Menu scrollbar. Click the folder’s dropdown arrow and choose the MapBusinessOnline option.

The Map App includes the Map Viewer app for free non-subscriber map sharing.

Please read customer reviews or review us at Capterra or g2crowd.

Contact: Geoffrey Ives at geoffives@spatialteq.com or Jason Henderson at jhenderson@spatialteq.com.

Posted in Business Mapping Software blog post, How to instruction, Sales and marketing | Tagged , , , , | Leave a comment