This blog describes the process for running the MapBusinessOnline Updater, found within the Map App folder. The MapBusinessOnline Updater ensures your software version is the latest available release. Read on for a complete understanding of how to access the Updater.
Thank you for using MapBusinessOnline Business Mapping Software.
Access to MapBusinessOnline begins when a new user registers for the free trial and subscription. We use your business email as the login credential for daily application access. The login process for MapBusinessOnline Standard & Pro requires an email and password. A change password option is presented at login.
The Map App & Updater
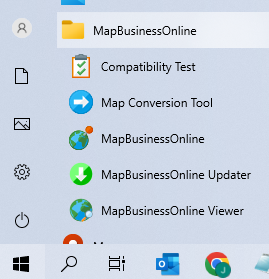
Once registered, a newly paid or free trial user must download the Map App. It’s an easy installation. Once installed, to access the MapBusinessOnline Map App from your desktop on Windows machines, use the Start Menu and scroll down to the MapBusinessOnline folder. Inside the Map App folder, use the Dropdown arrow to view the five options included in the Map App.
The Map App provides five specific functions, listed here in dropdown order:
- Compatibility Test – We may ask you to run this test if you get Internet access or other network errors. The Compatibility test will often return port identifiers that require settings adjustments.
- MapPoint Conversion Tool – Use this tool to see if your map project in MapPoint can be converted to MapBusinessOnline. Feel free to ask for assistance.
- MapBusinessOnline – Use this button to launch the MapBusinessOnline application. You can drag the icon to your desktop or taskbar for a launch button. I made mine a Start button launch icon.
- MapBusinessOnline Updater – The Updater will update the software to the latest release. Use this button to correct aberrant behavior in the application. When in doubt – run the Updater.
- MapBusinessOnline Viewer – The viewer enables public map sharing. Use this button to view a shared business map created by a MapBusinessOnline subscriber.
On Mac machines, find the Map App in the Applications folder.
Run the Updater
Running the MapBusinessOnline Updater is fast and easy. It’s a good idea to run the Updater regularly to stay on top of software updates.
Software controls are not behaving as expected. Software issues that suggest an update is necessary:
- Background map access is impeded or missing.
- Features are missing from the popup menus.
- Other random issues.
When in doubt – run the Updater.
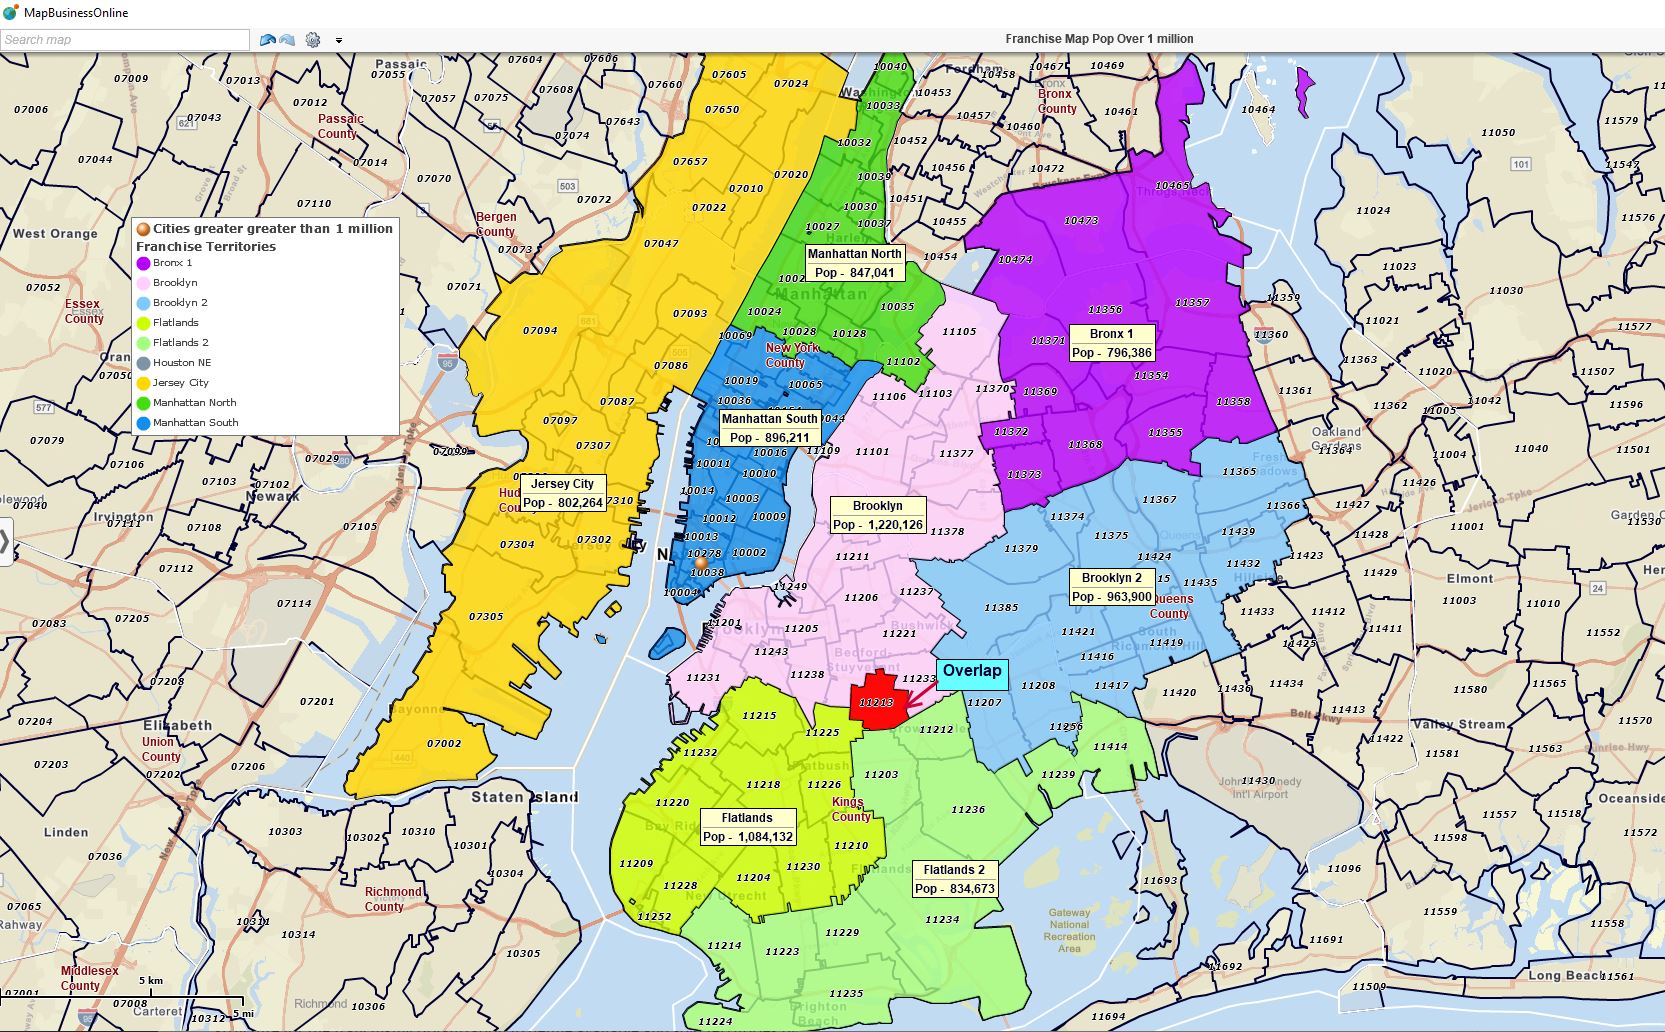
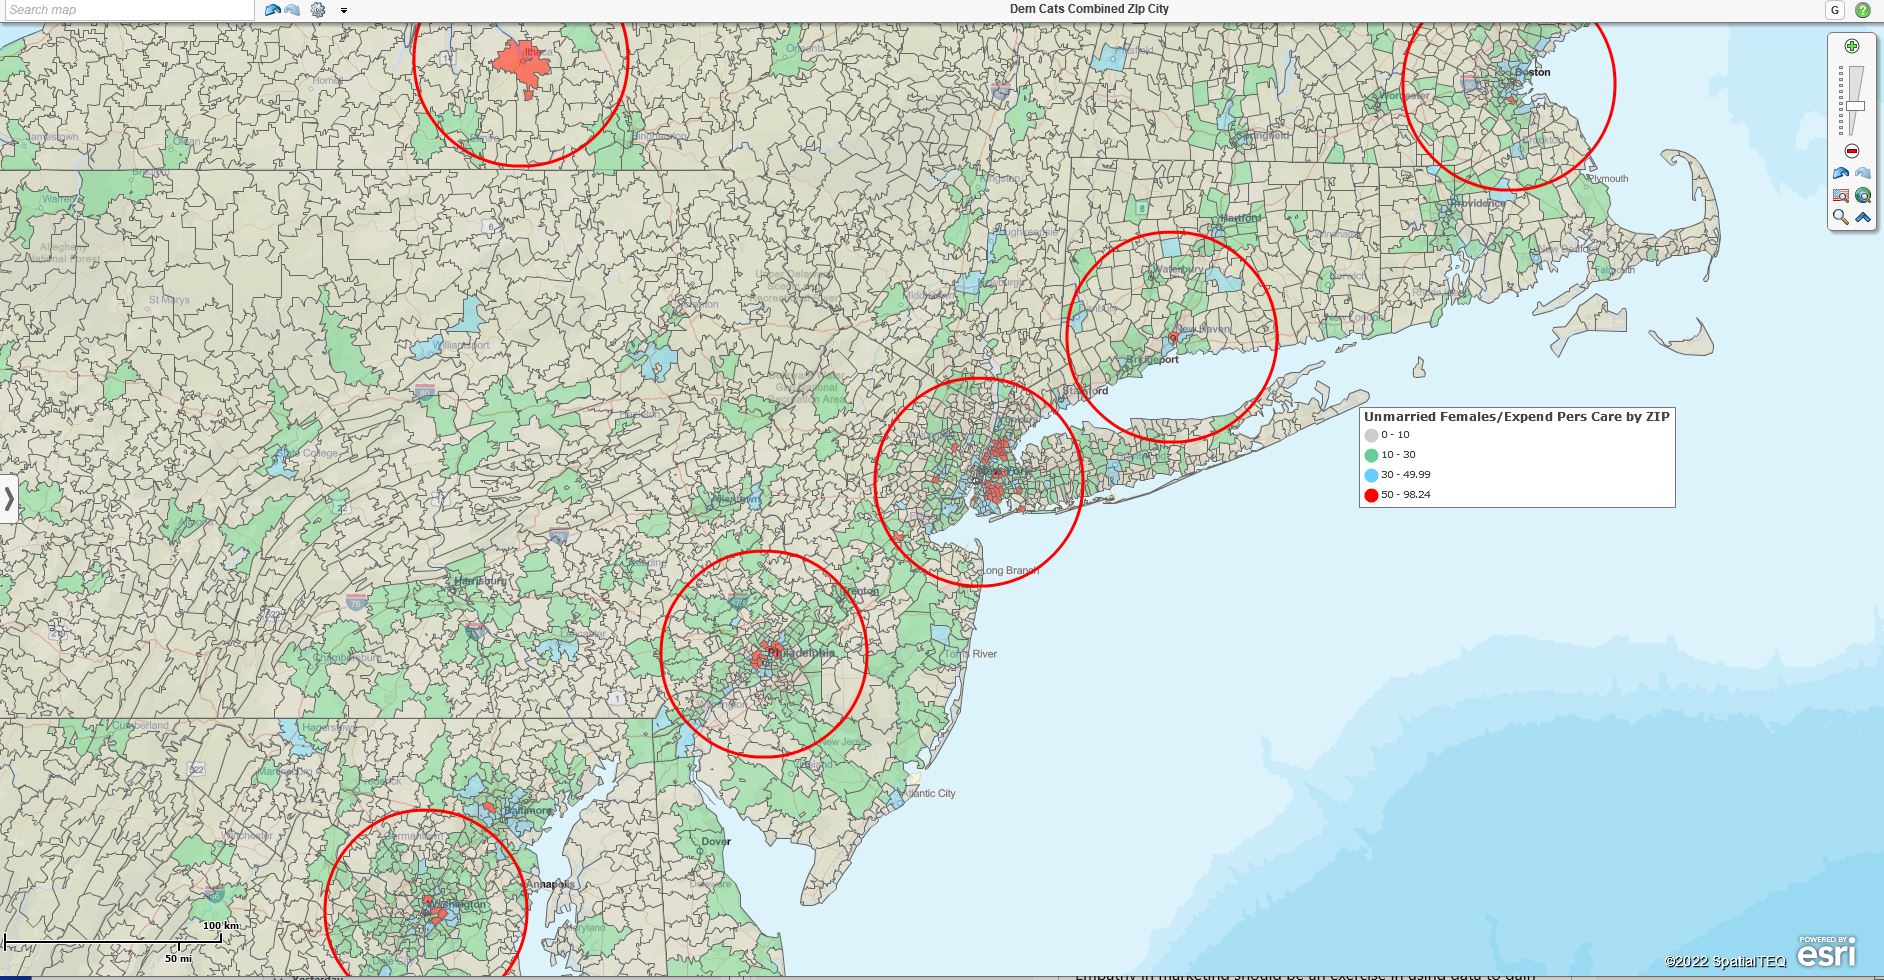
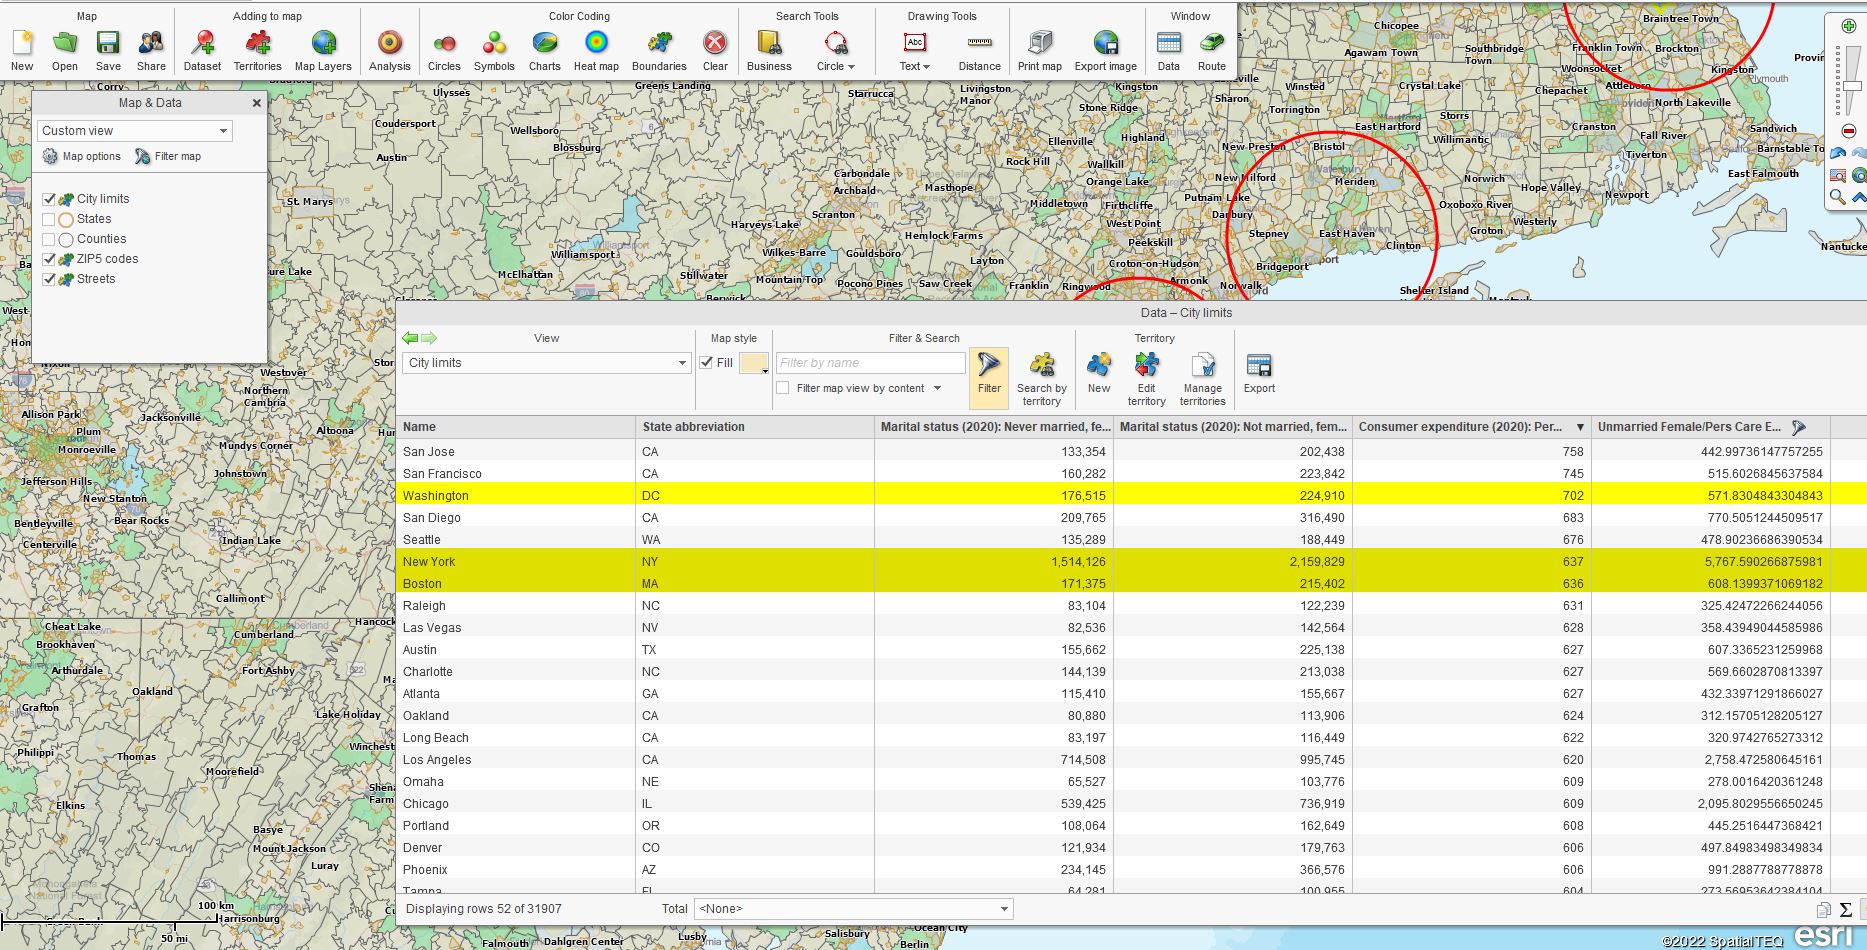
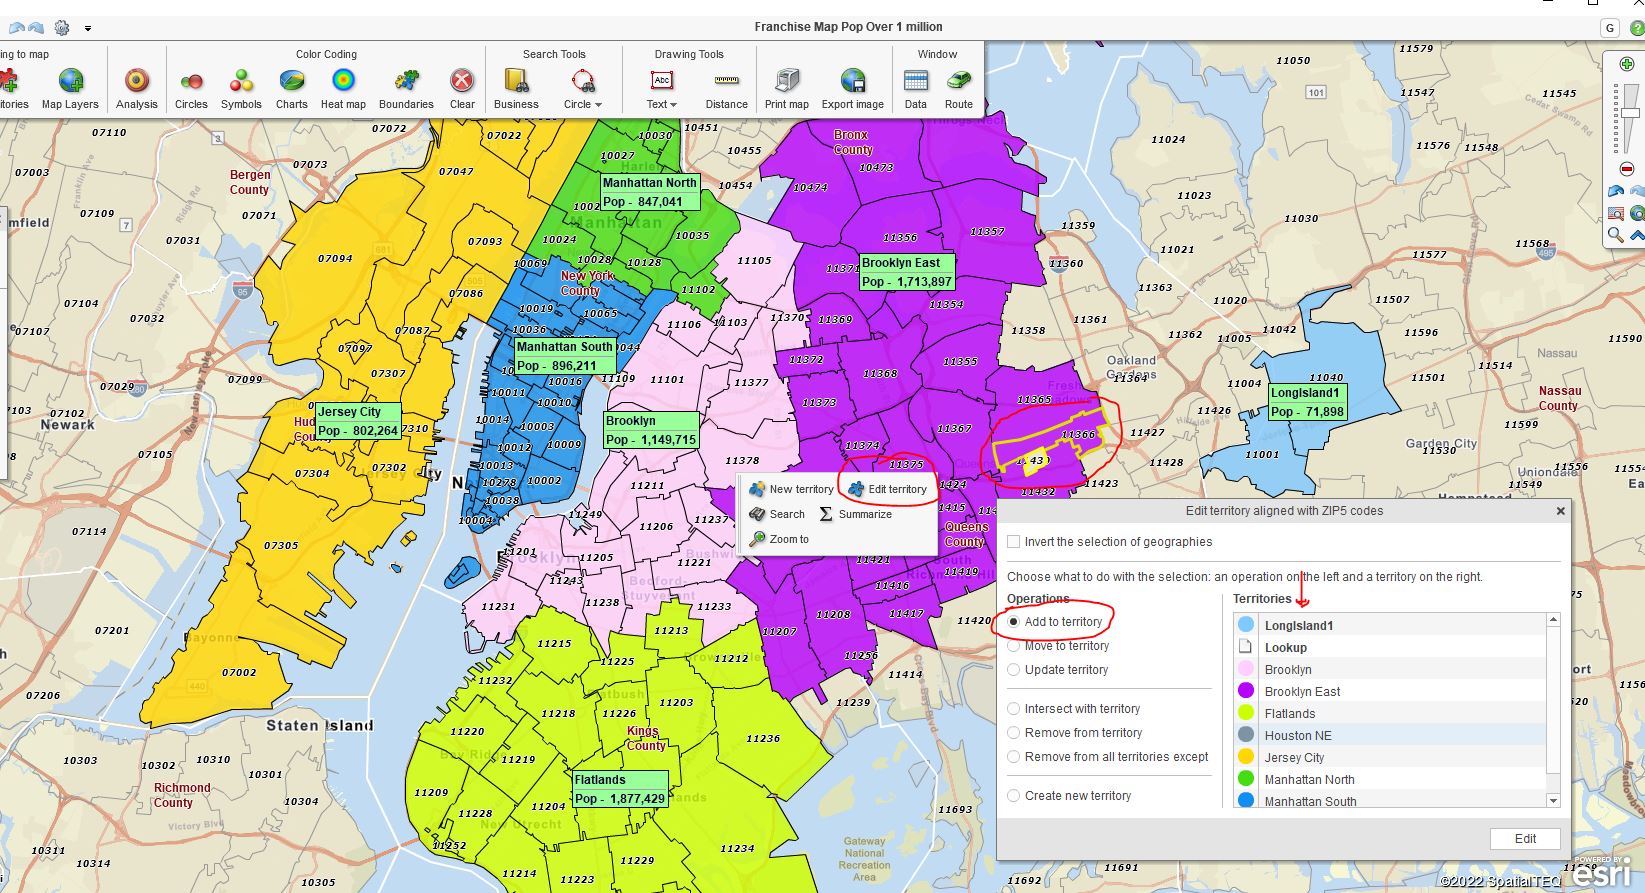
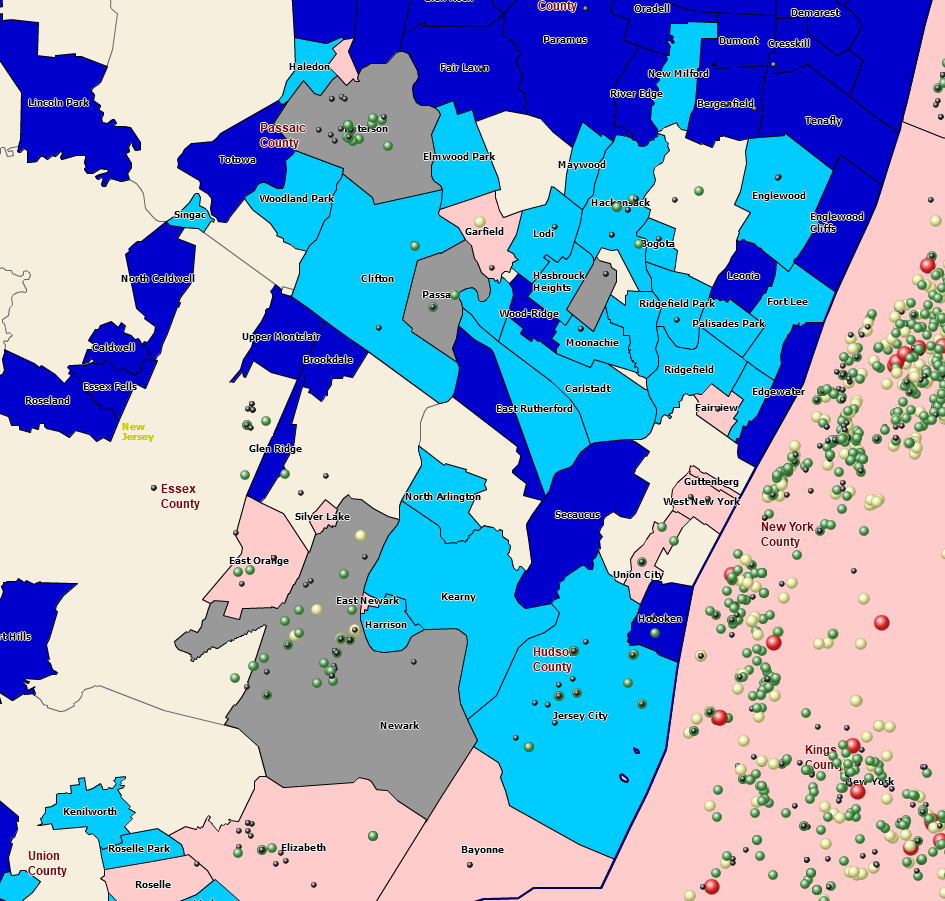
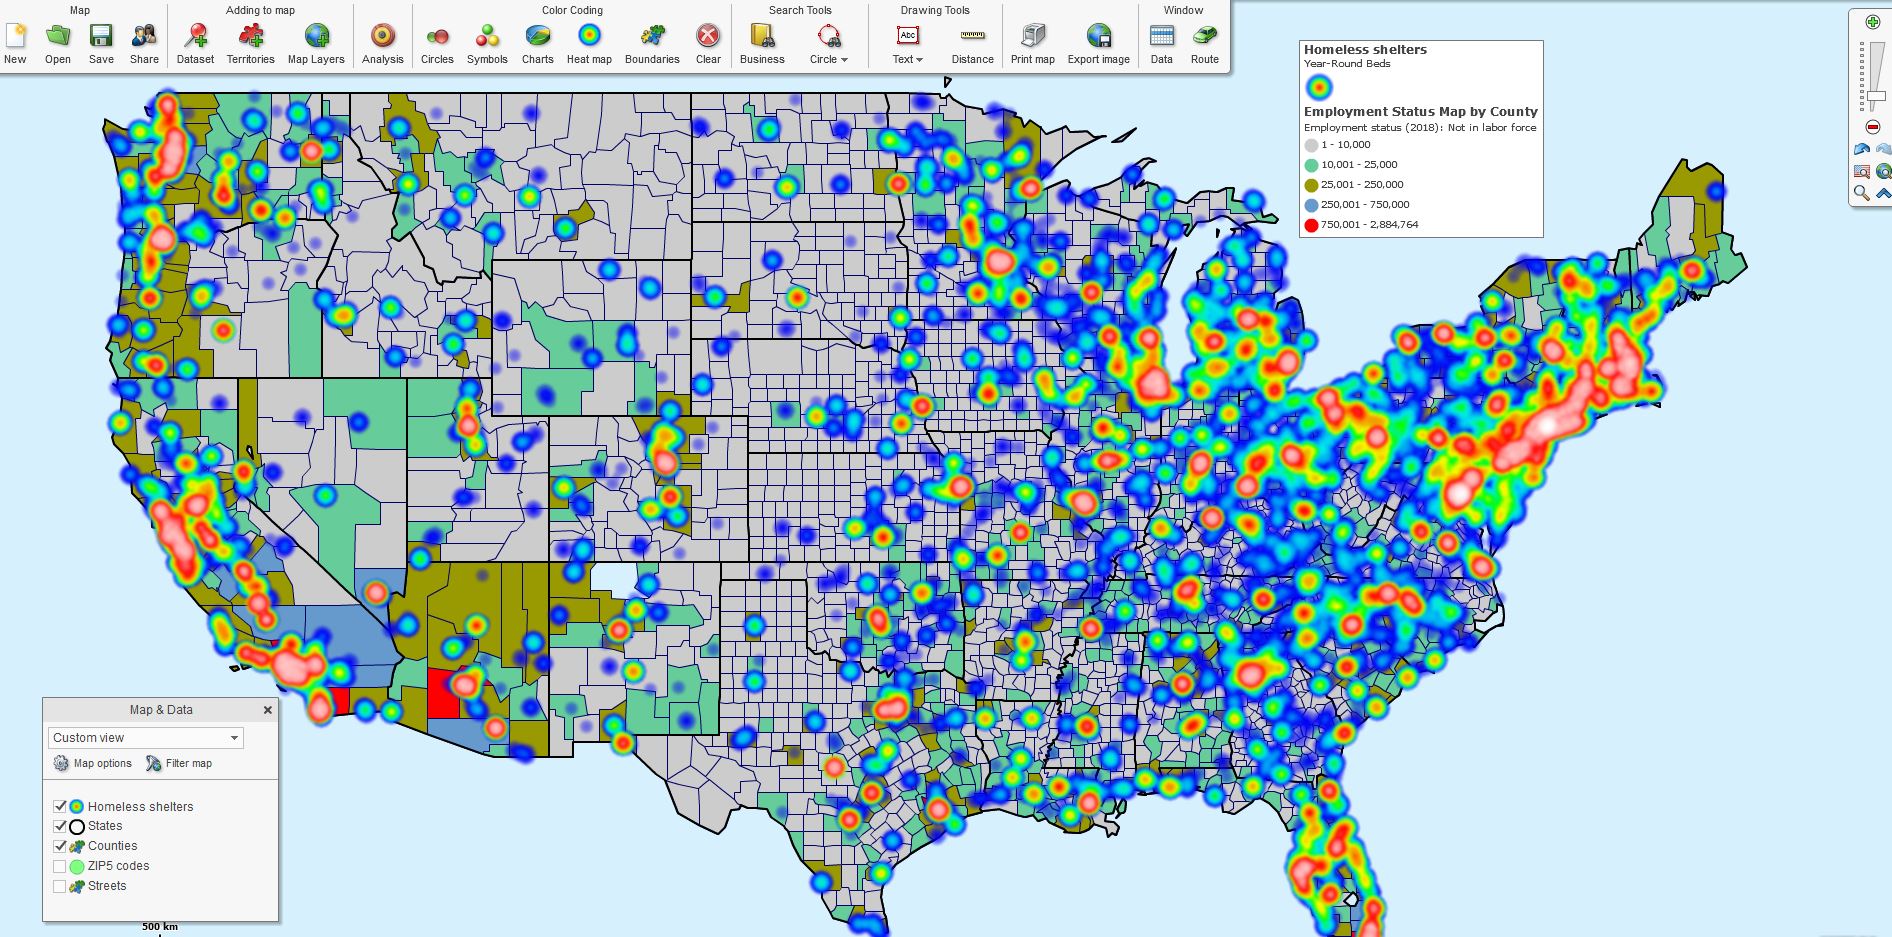
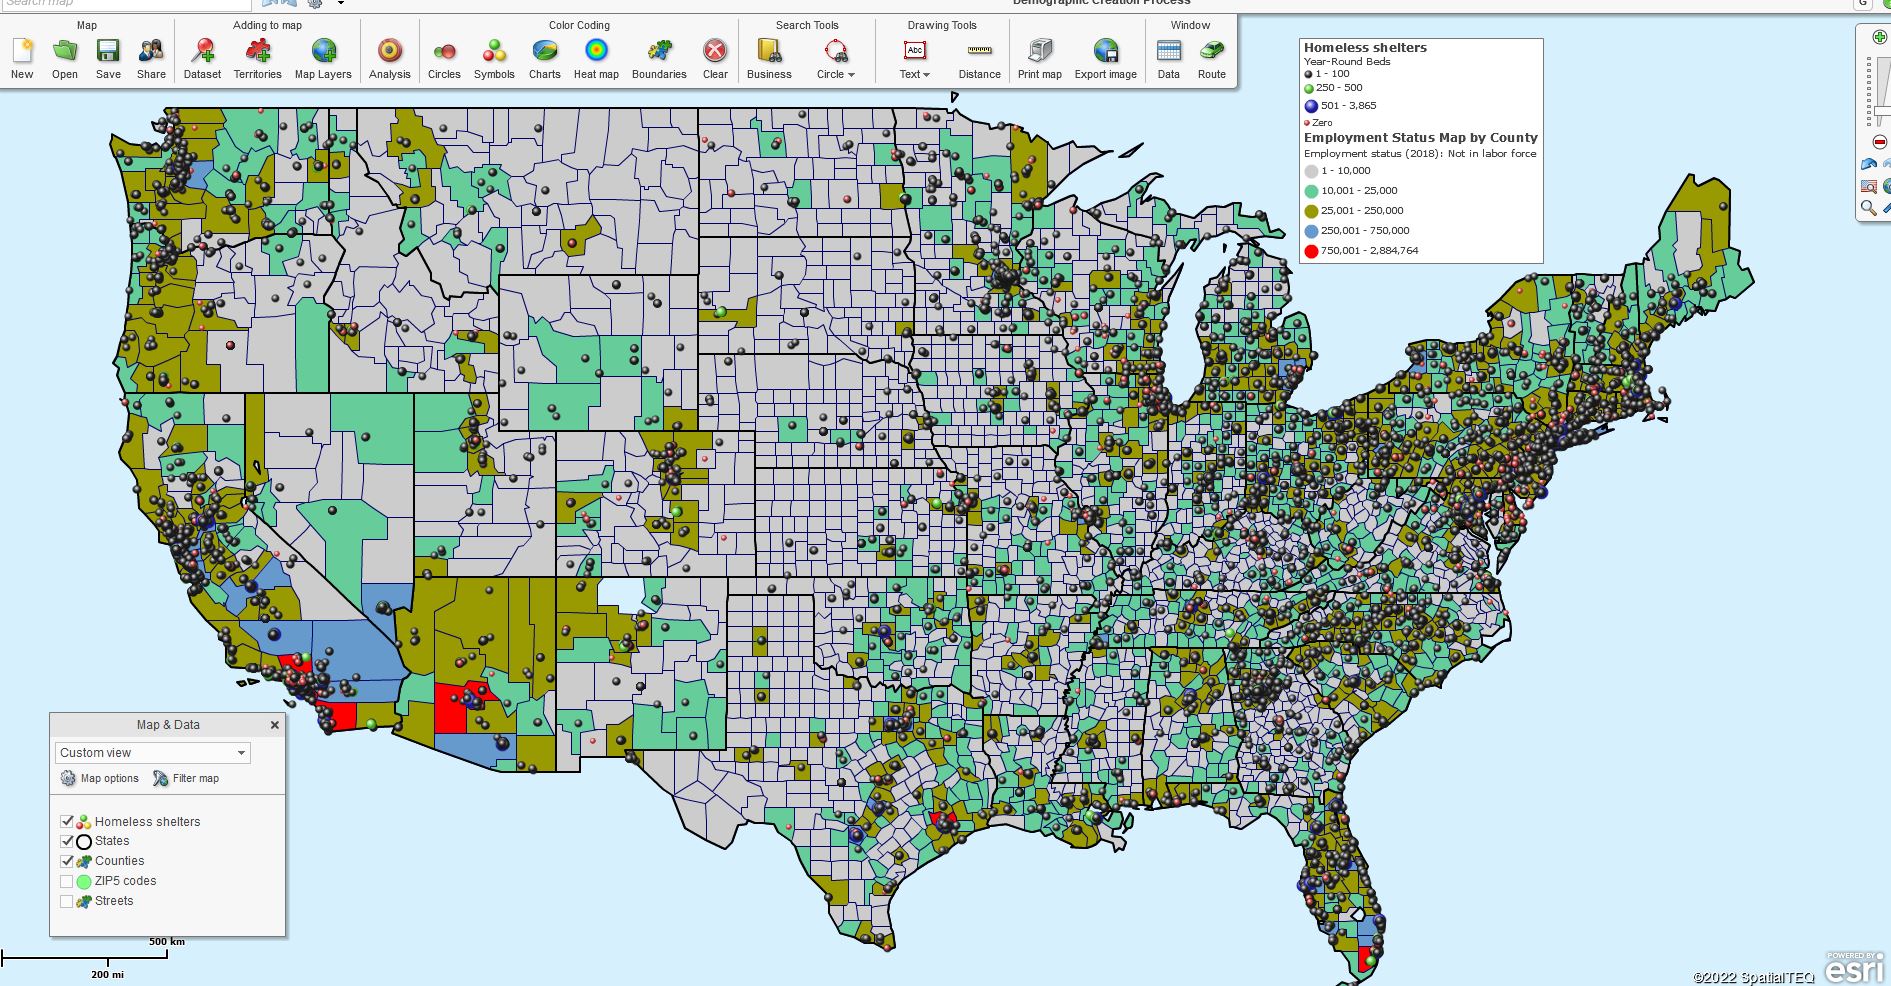
NYC Franchise Map Created Using MapBusinessOnline.
Technical Support Options
If you run into system errors when using MapBusinessOnline, run that Updater. But if bad things persist, which is rare, contact us via email and always include a screenshot of the error. We’ll get back to you rapidly within regular East Coast working hours. Outside of those times, we will do our best.
Email addresses: JHenderson@spatialteq.com or Geoffives@spatialteq.com
There is also a chat service located on the website – MapBusinessOnline.com.
And of course, there is always phone contact – 800-425-9035. But phone contact will lead directly to a request for an email containing error messages.
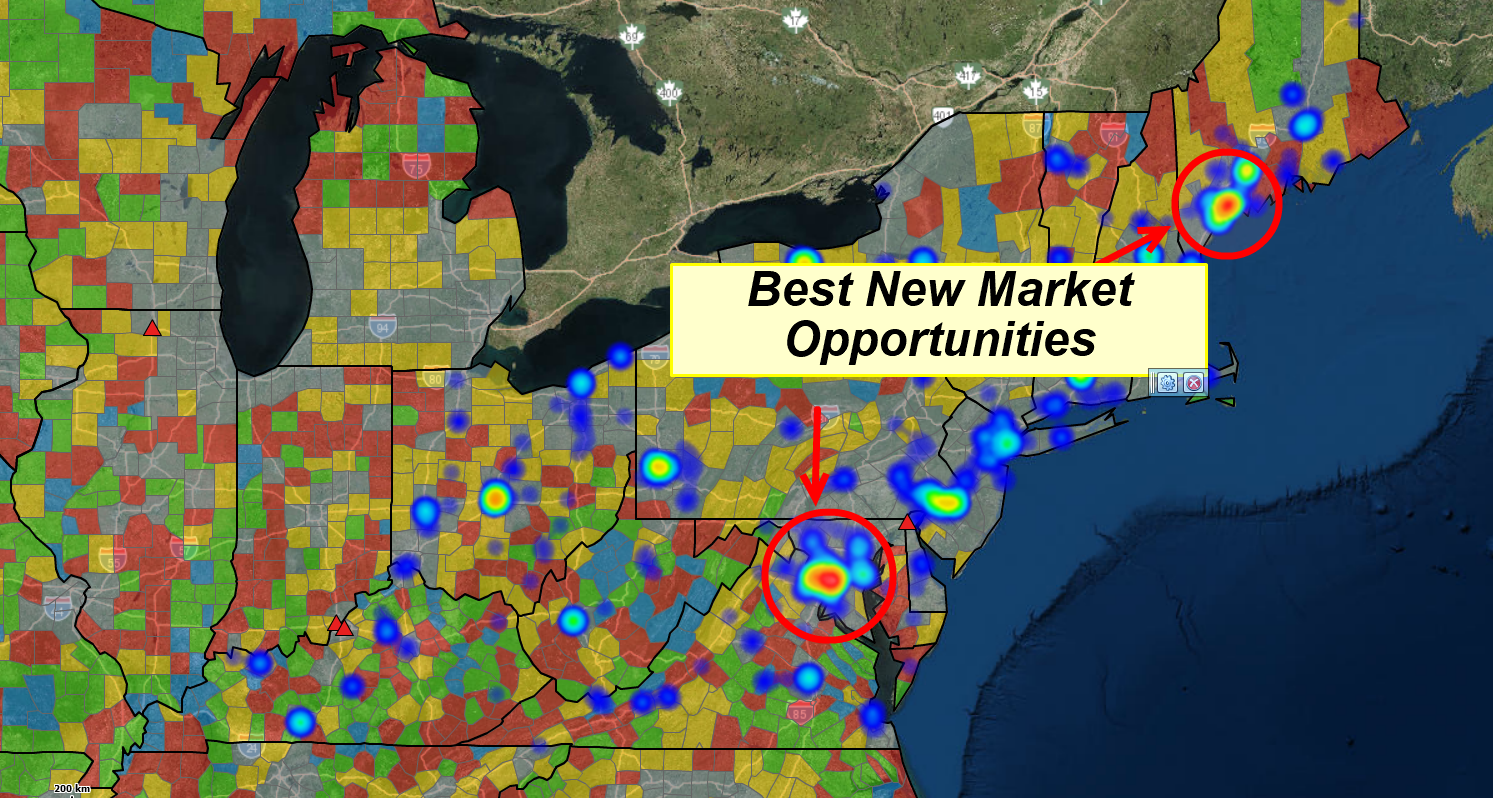
Thank you for using MapBusinessOnline.com, your access to business map visualizations, sales territories, drive time calculations, and new market analysis.
_______________________________________________
Discover why over 25,000 business users log into www.MapBusinessOnline.com for their business mapping software and advanced sales territory mapping solution. The best replacement for Microsoft MapPoint happens to be the most affordable.
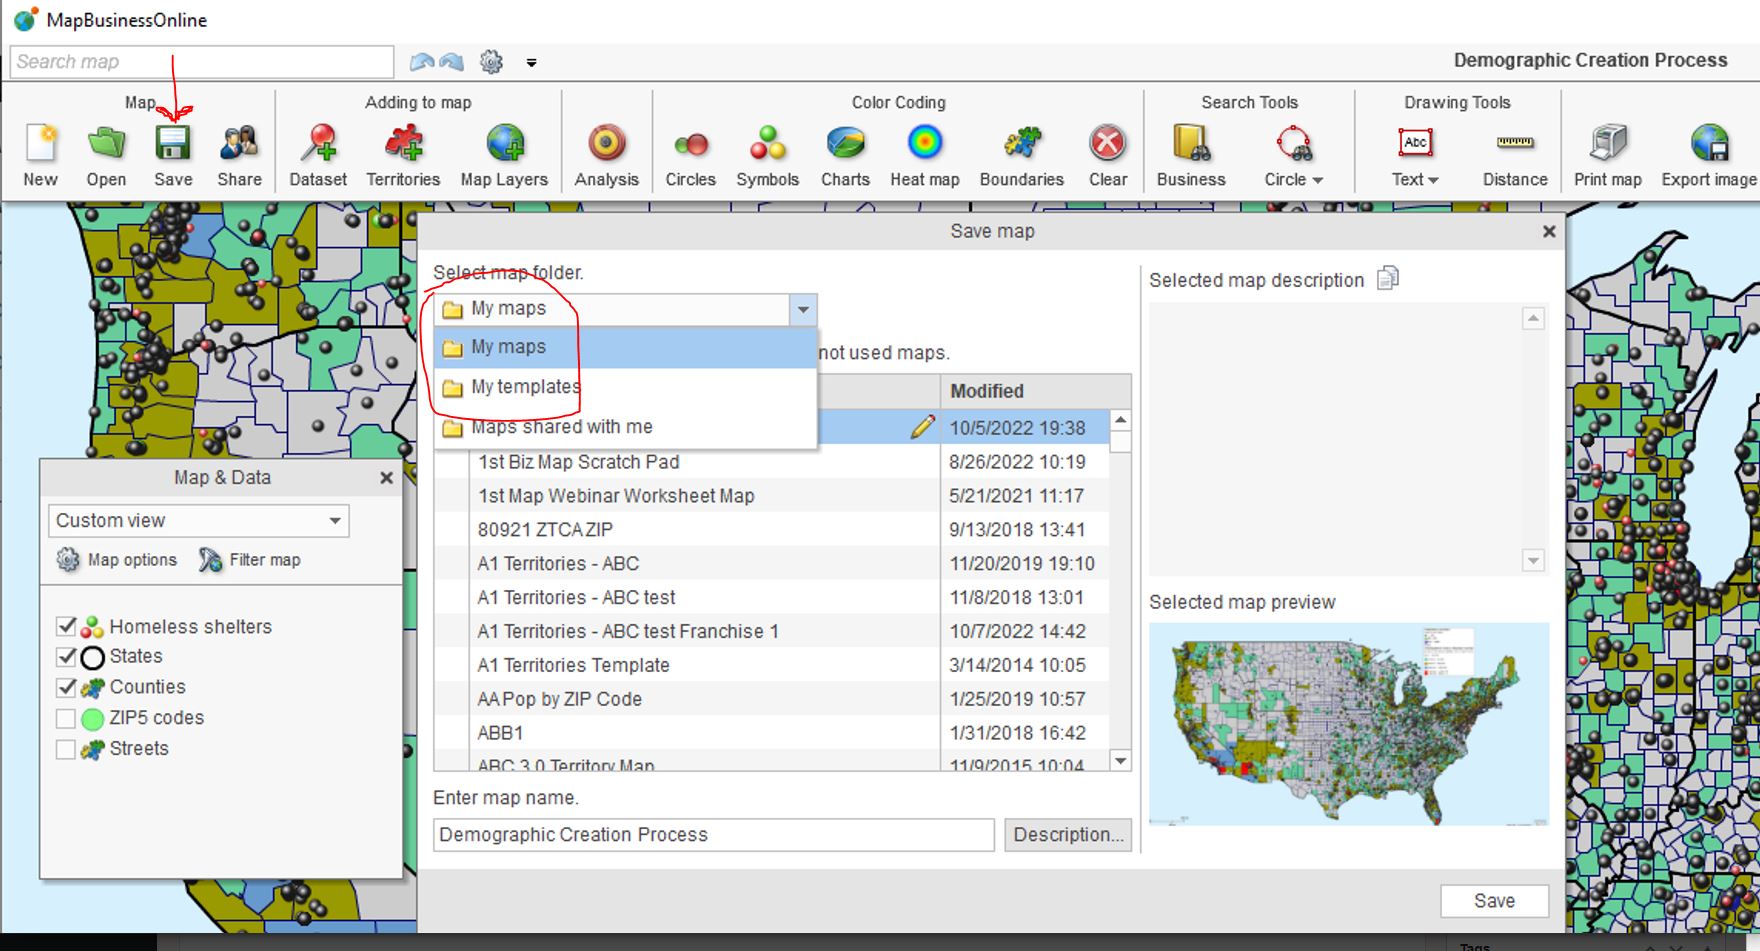
To access MapBusinessOnline, please register and download the Map App from the website – https://www.mapbusinessonline.com/App-Download.aspx.
After installing the Map App, the MapBusinessOnline launch button will be in the Windows Start Menu or Mac Application folder. Find the MapBusinessOnline folder in the Start Menu scrollbar. Click the folder’s dropdown arrow and choose the MapBusinessOnline option.
The Map App includes the Map Viewer app for free non-subscriber map sharing.
Please read customer reviews or review us at Capterra or g2crowd.
Contact: Geoffrey Ives at geoffives@spatialteq.com or Jason Henderson at jhenderson@spatialteq.com.